Monitoring Tasks
Tasks initiated by Zerto are also displayed in the vSphere Web Client and Client console.
Recent tasks can also be reviewed for a site by clicking the TASKS area in the status bar at the bottom of the user interface.

The following information is displayed for each task:
Status: The task status.
Name: The name of the task.
Description: A description of the task.
Action: The ability to perform an action directly. For example, stop a failover test, or commit or rollback a move or failover operation.
The full details of the tasks can be monitored in the TASKS subtab under the MONITORING tab.
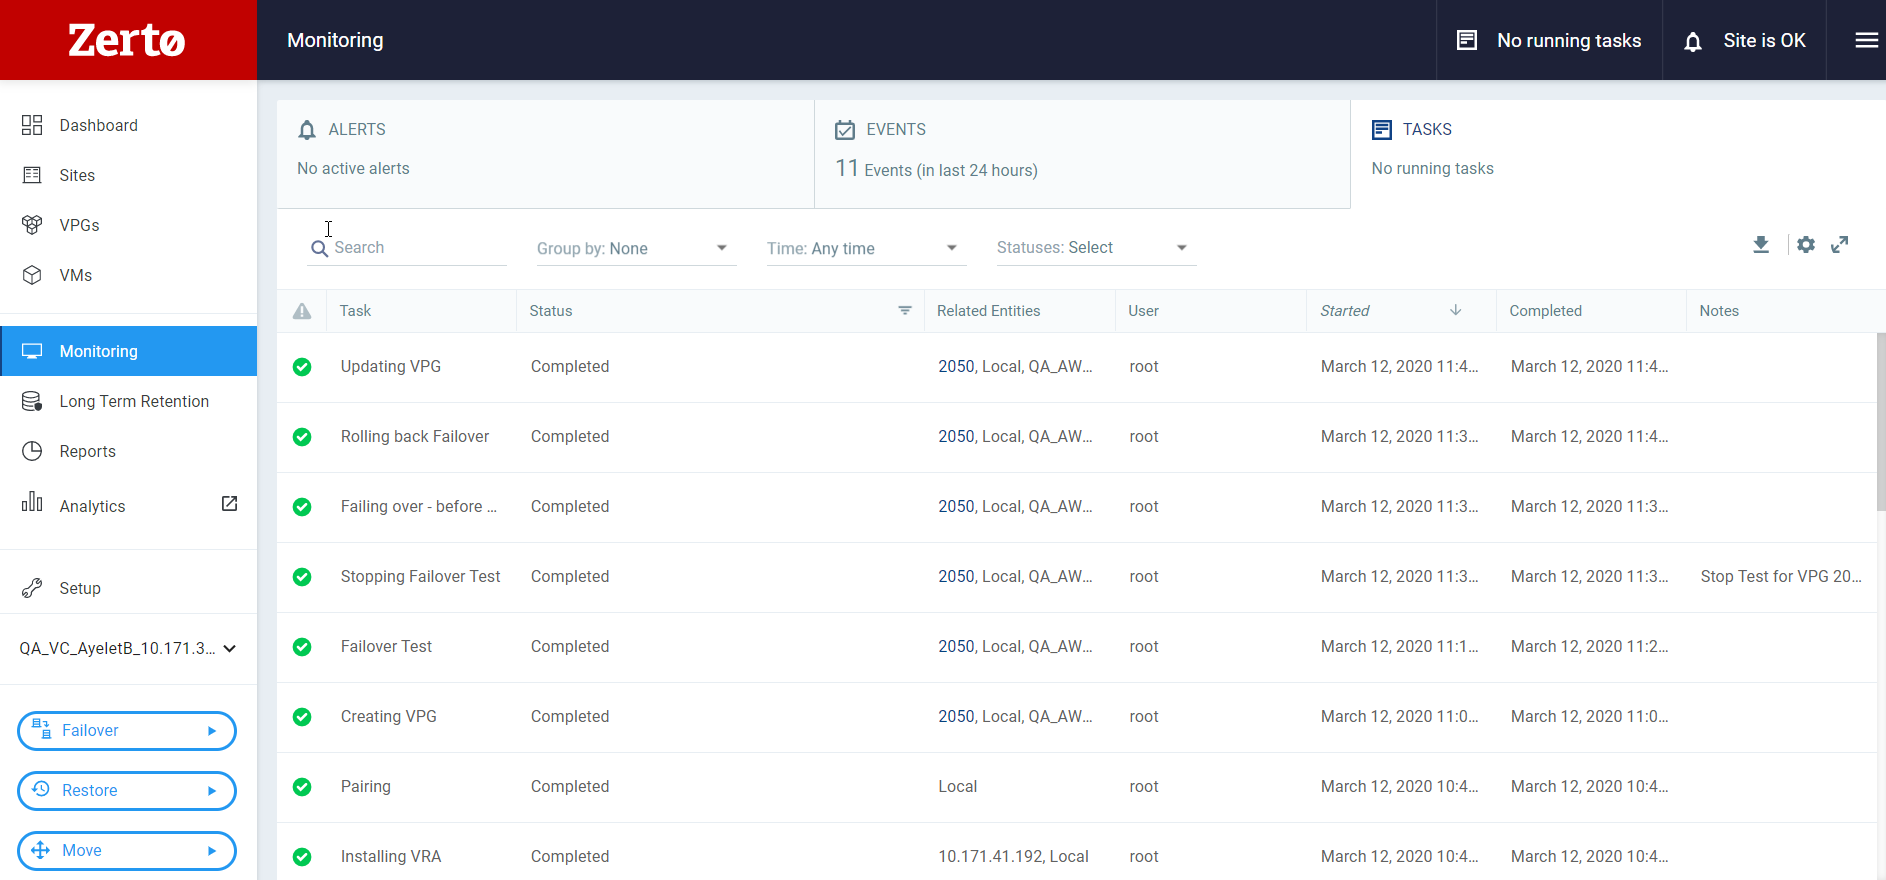
The following information is displayed for each task:
Task status indicator: The color indicates the status of the task. The following statuses exist for each task:
Green: The task was completed successfully.
Red: The task failed.
Task: The task name.
Status: The task status.
Related Entities: The sites which were effected by the task.
User: The user who initiated the task.
Started: The date and time the task started.
Completed: The date and time the task completed.
Notes: Notes added at the completion of a failover test.
See also:
| • | The DASHBOARD Tab |
| • | Monitoring VPGs – The VPGs Tab |
| • | Monitoring a Single VPG |
| • | Monitoring Long-term Retention |
| • | Monitoring Protected Virtual Machines – The VMs Tab |
| • | Monitoring Peer Sites – The SITES Tab |
| • | Monitoring Virtual Replication Appliances |
| • | Zerto Performance Counters |
| • | Monitoring Long-term Retention |