Monitoring a Single VPG
You can monitor the status of a specific VPG by clicking the VPG name in the VPGs tab or clicking the VPG name in the VMs tab. The VPG details are displayed in a dynamic tab.
General Tab
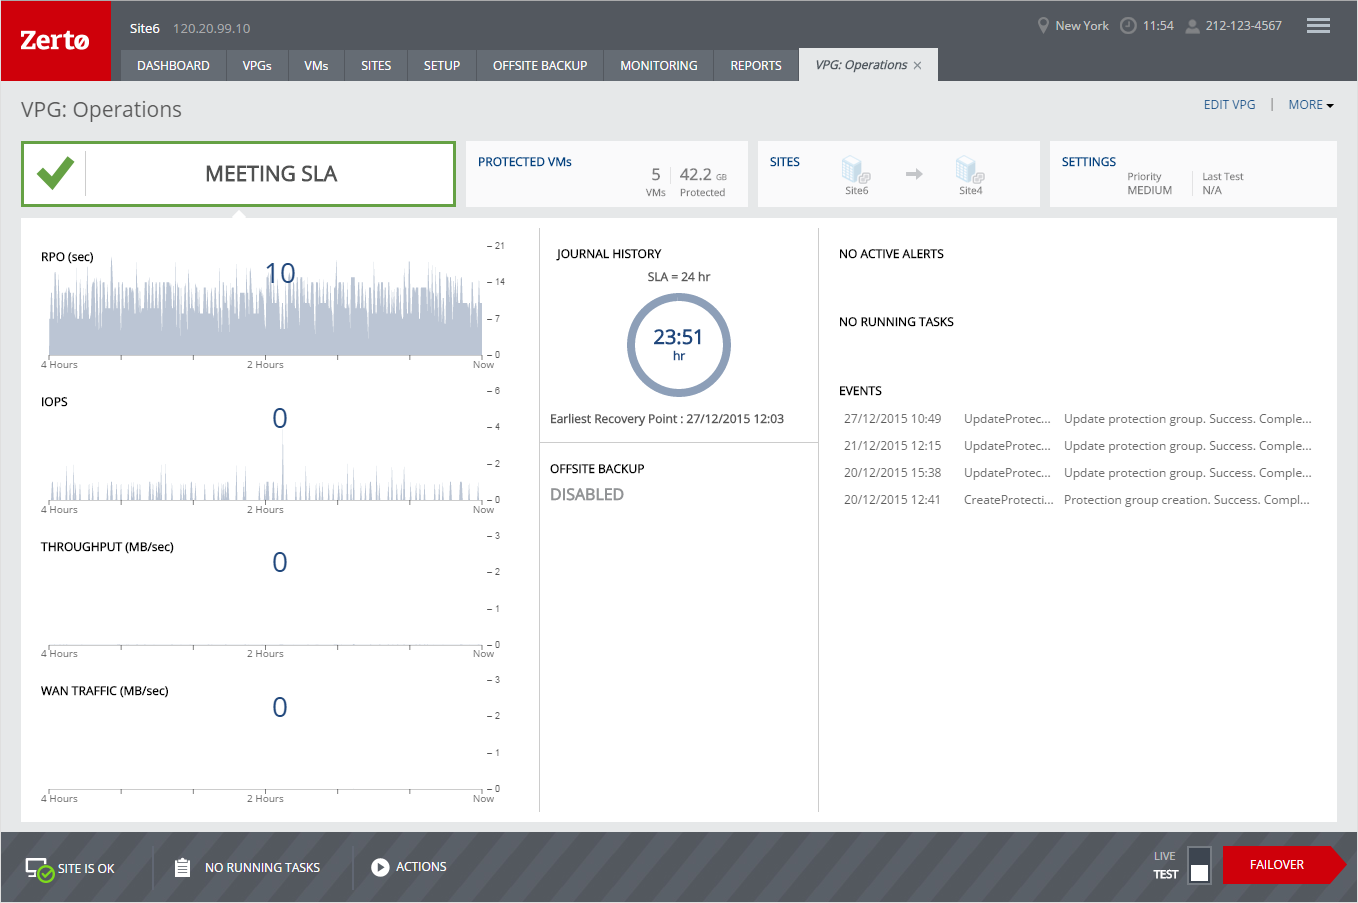
The tab on the left side shows the status of the VPG. The following information is displayed in this tab:
Performance Graphs
The current VPG performance, which includes the following information:
RPO (sec) – The time since the last checkpoint was written to the journal. This should be less than the Target RPO Alert value specified for the VPG.
IOPS – The IO per second between all the applications running on the virtual machines in the VPG and the VRA that sends a copy to the remote site for replication.
Throughput (MB/sec) – The MB per second for all the applications running on the virtual machines being protected. There can be a high IO rate with lots of small writes resulting in a small throughput as well as a small IO with a large throughput. Thus, both the IOPS and Throughput values together provide a more accurate indication of performance.
WAN TRAFFIC (MB/sec) – The outgoing traffic between the sites.
JOURNAL HISTORY
The journal history shows:
■ The SLA defined for the VPG.
■ The amount of time currently covered by information in the journal.
■ The earliest—oldest—checkpoint currently in the journal that can be used for a recovery operation.
OFFSITE BACKUP
If backup is enabled, the following backup details are displayed.
Retention Policy – Whether the VPG is protected against a disaster only with the ability to recover to a point in time up to 14 days before the disaster, or protection is extended to include offsite backups of the virtual machines, going back for a maximum of one year.
Backup Status – The status of the backup.
Backup Repository – The name of the repository where the jobs are stored.
Restore Point Range – The restore points for the backup jobs out of the total backup jobs run for the VPG.
Backup Scheduling – The schedule for offsite backups.
ACTIVE ALERTS, RUNNING TASKS, and EVENTS
A listing of the currently active alerts and running tasks, and the events run during the last few hours.
User input, for example, stopping a failover test or committing or rolling back a Move or Failover operation, can be initiated from the relevant task displayed in the RUNNING TASKS section.
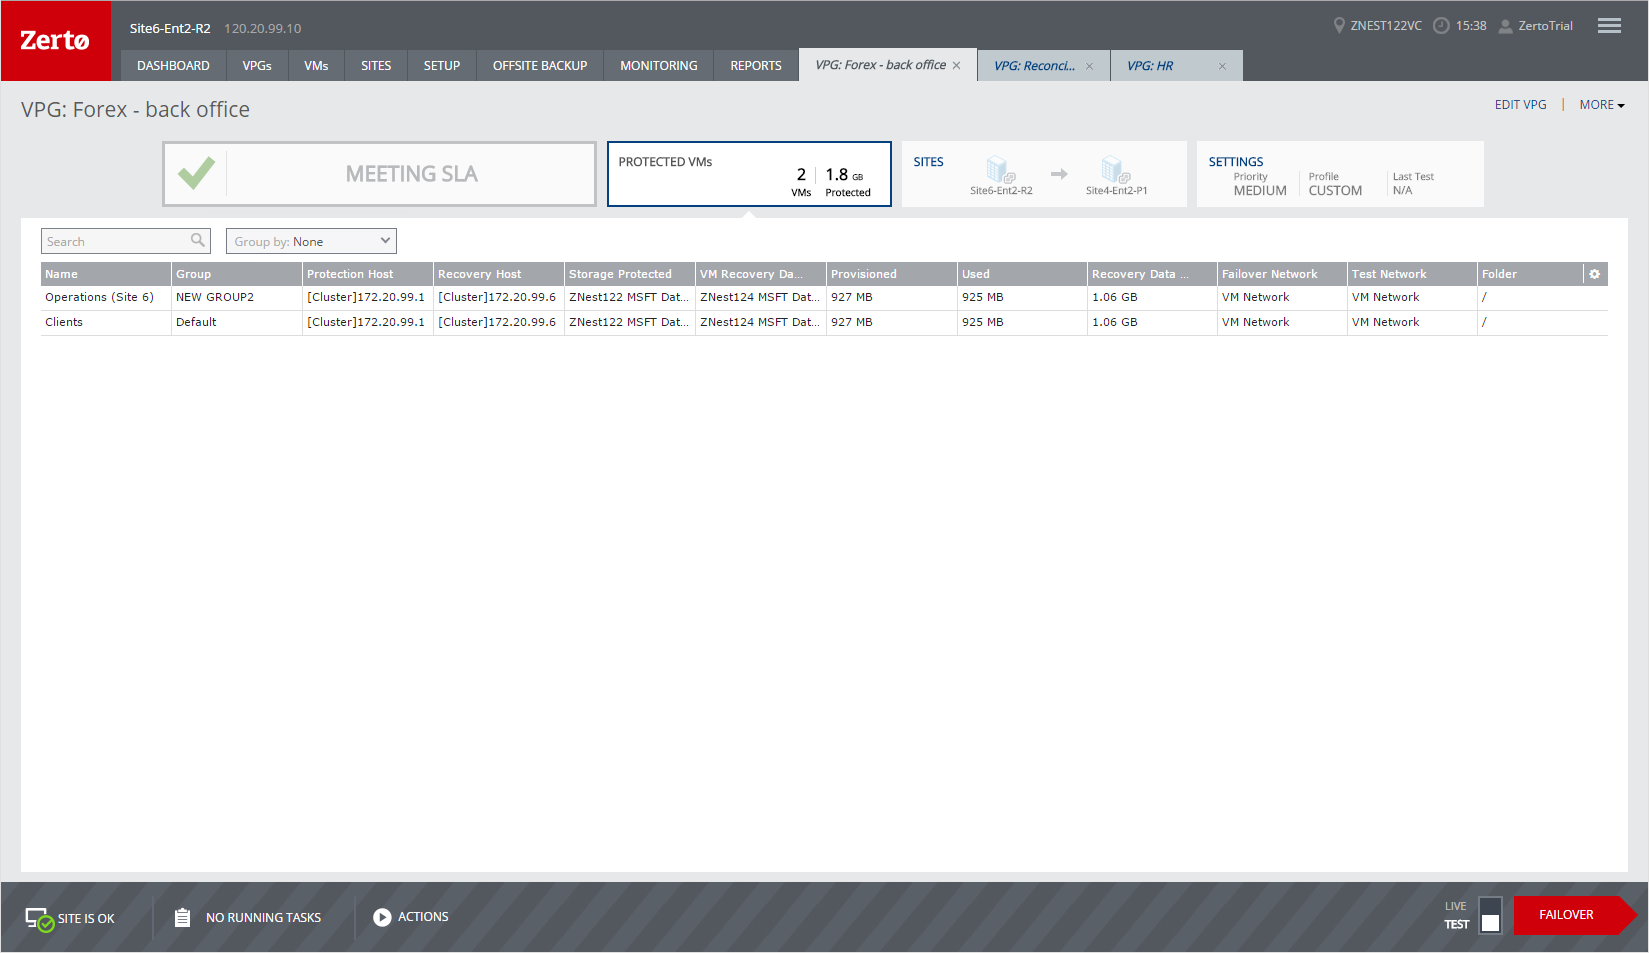
PROTECTED VMs Tab
The PROTECTED VMs tab shows details about the protected virtual machines. This includes:
■ The name of the virtual machine.
■ The boot order group to which the virtual machine belongs.
■ The protected virtual machine host.
■ The host to use for recovery.
■ The datastore used on the protected site.
■ The recovery datastore.
■ The protected virtual machine provisioned storage.
■ The protected virtual machine used storage.
■ The amount of data used on the recovery site for this virtual machine.
■ The storage profile of the recovery site.
■ The failover and test networks that will be used for this virtual machine.
■ The folder where the virtual machine is recovered to.
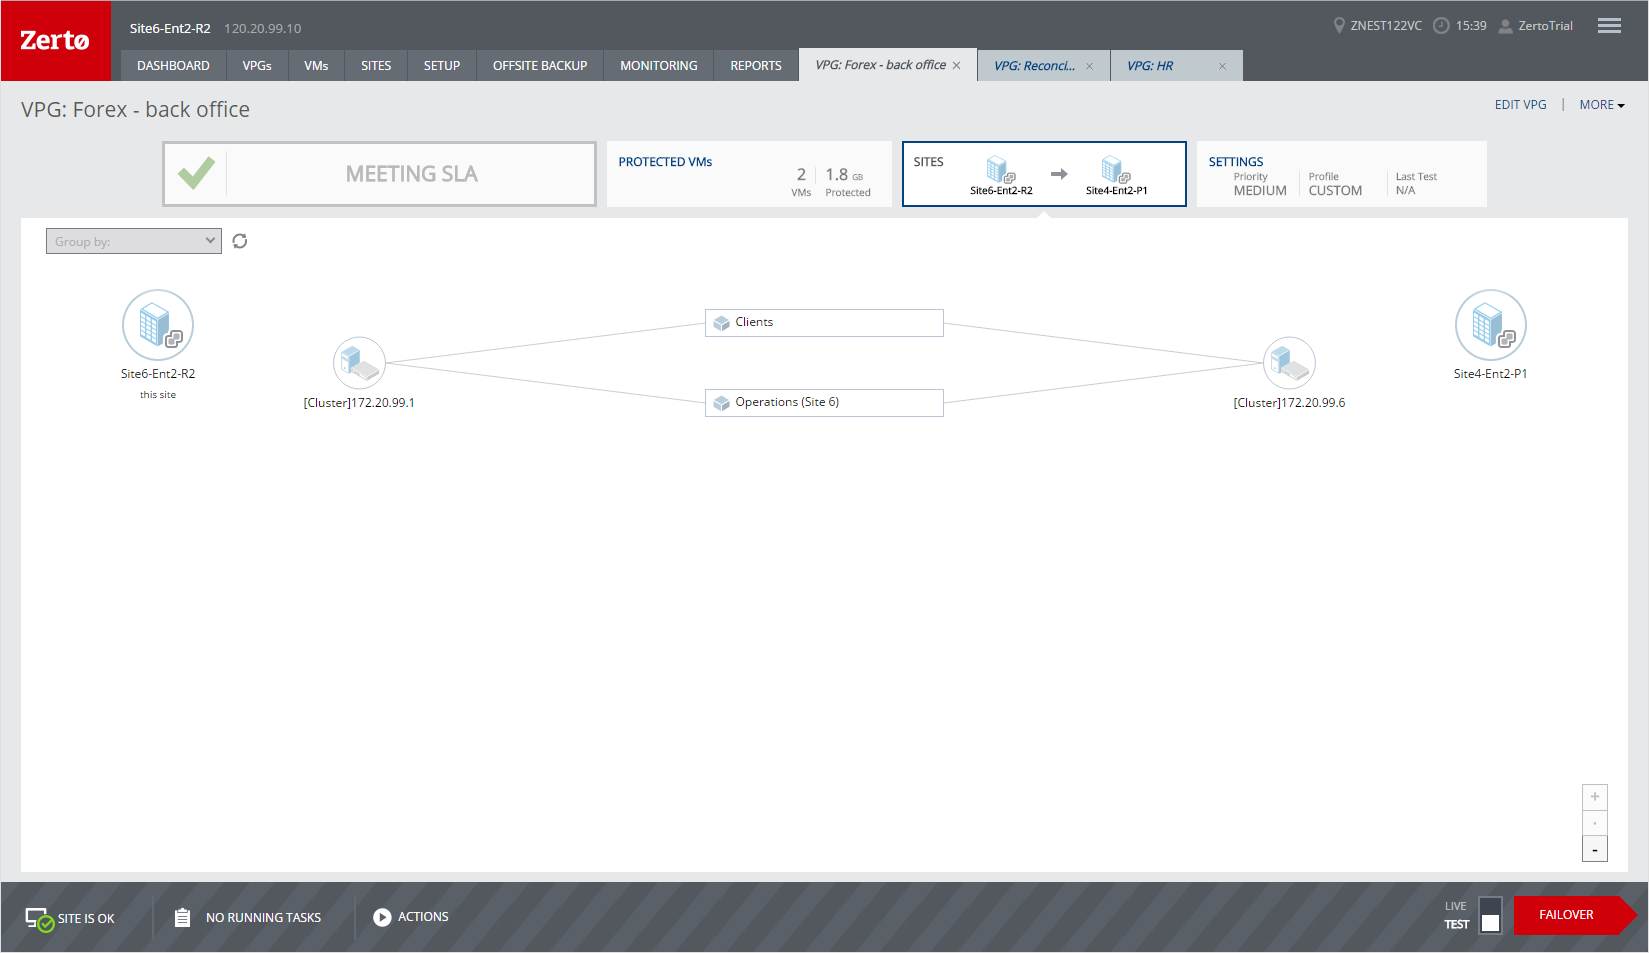
SITES Tab
The SITES tab shows the topology of the VPG, including both the protected and recovery sites.
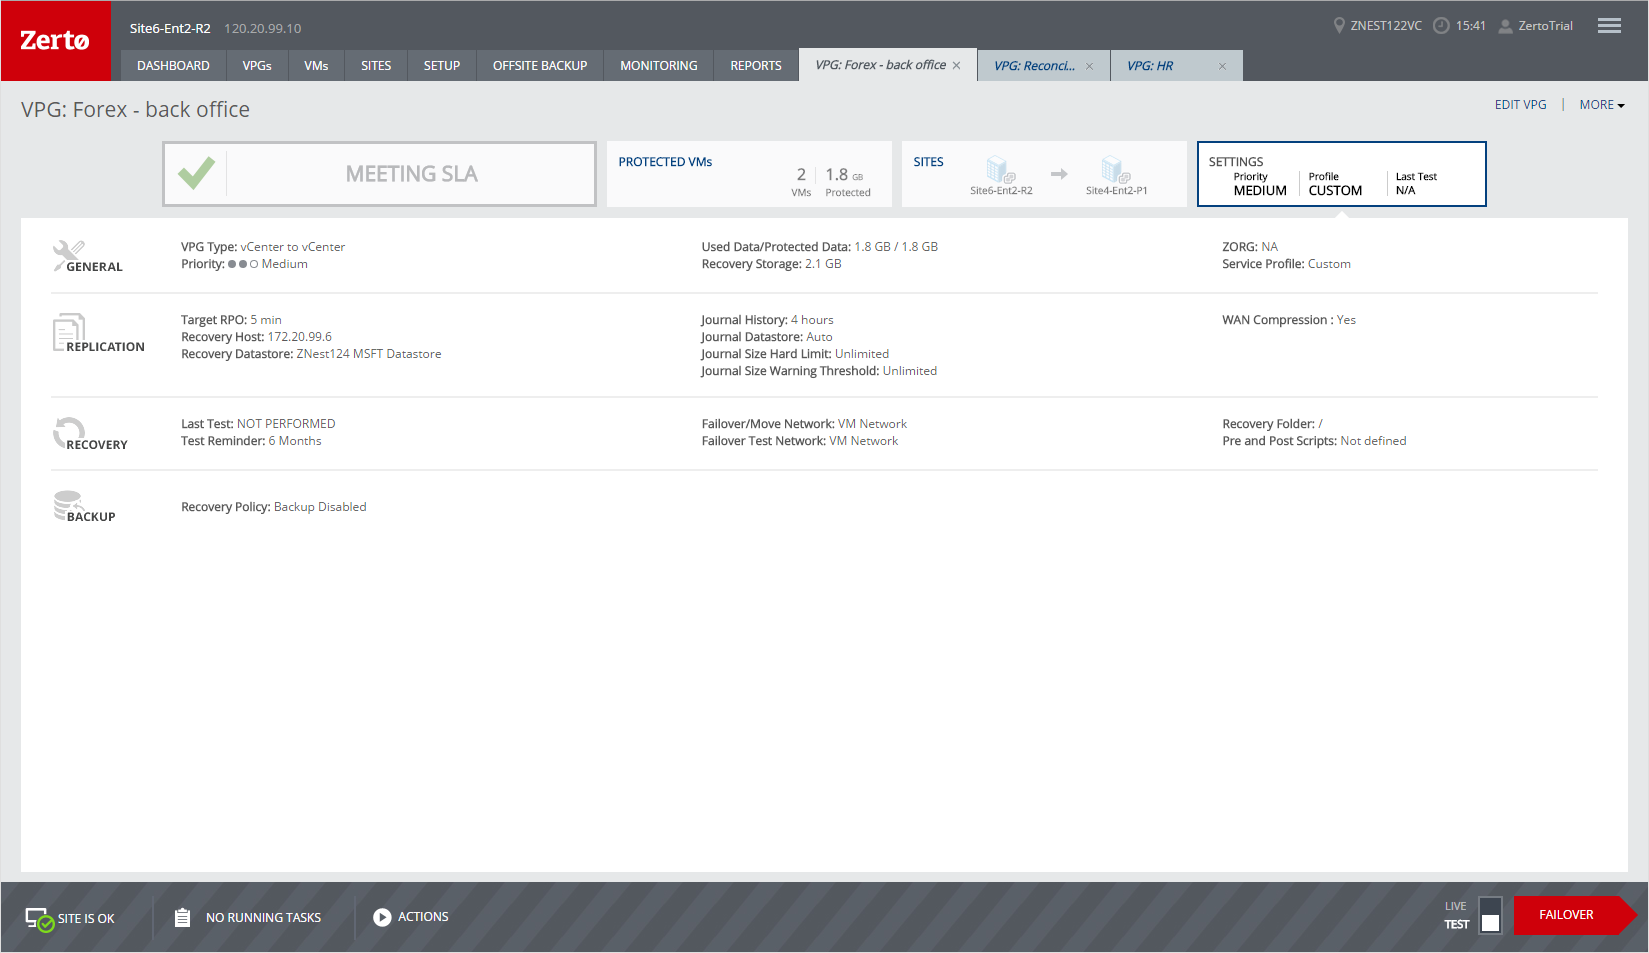
SETTINGS Tab
The SETTINGS tab shows details about the VPG settings, divided into general, replication, recovery, and backup categories.