Working With the Zerto User Interface
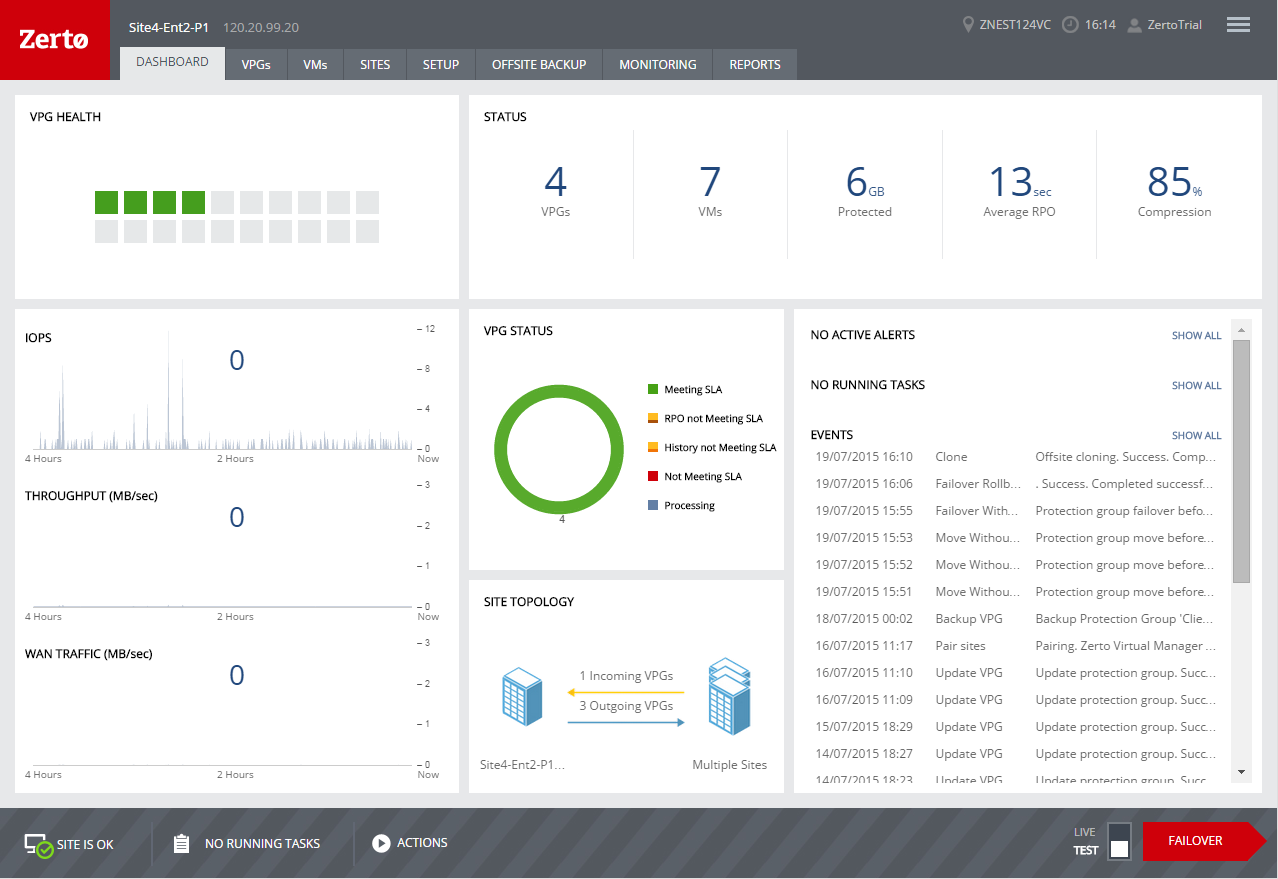
After logging on to the Zerto User Interface for the first time, the dashboard is displayed. The dashboard provides summary information about the status of the site, as shown in the following diagram:
Use the tabs to access the specific information you want:
DASHBOARD – General information about the site, including the status of the VPGs being protected or recovered to the site.
VPGs – All the VPGs from both the local and remote sites and provides summary details of each VPG.
VMs – All the protected virtual machines from both the local and remote sites and provides summary details of each virtual machine.
SITES – Details of the paired sites. This tab lists all the paired sites to the local site and provides summary details of each paired site.
SETUP – Details about VRAs, storage and repositories.
OFFSITE BACKUP – Details of the offsite backup jobs either by VPG or virtual machine. This tab lists all the defined offsite backups and their statuses.
MONITORING – Details about the alerts, events and tasks for the site.
REPORTS – General reports.
Subtabs
The SETUP, OFFSITE BACKUP and MONITORING tabs and details of a specific VPG and VRA can be viewed from different perspectives via subtabs. For example, under SETUP you can manage VRAs, storage and repositories via subtabs.
Views
Lists can be displayed with different views. For each view you can filter the information in columns via the filter icon next to each column title. Clicking the column title enables sorting the column in ascending to descending order.
You can customize the default views or add a new view by clicking the view configuration button.
Customize a default view by selecting Show/Hide Columns and then checking the columns you want displayed. Create a new view by selecting Create View.