![]()
H2O Flow is an open-source user interface for H2O. It is a web-based interactive environment that allows you to combine code execution, text, mathematics, plots, and rich media in a single document.
With H2O Flow, you can capture, rerun, annotate, present, and share your workflow. H2O Flow allows you to use H2O interactively to import files, build models, and iteratively improve them. Based on your models, you can make predictions and add rich text to create vignettes of your work - all within Flow's browser-based environment.
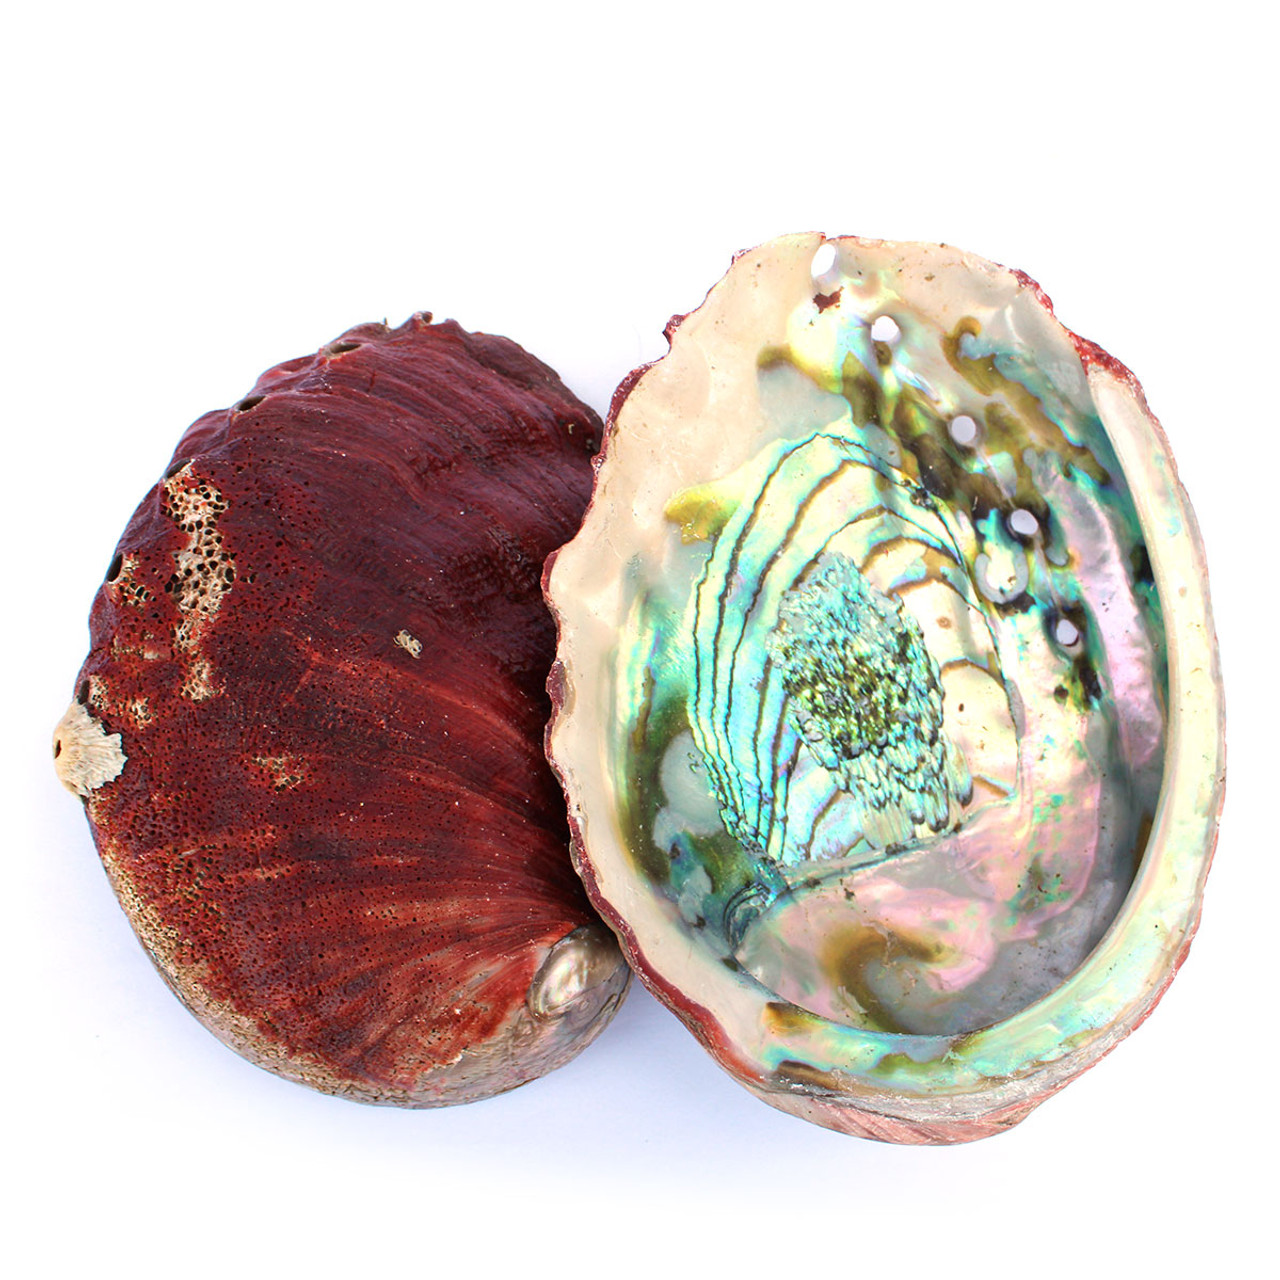
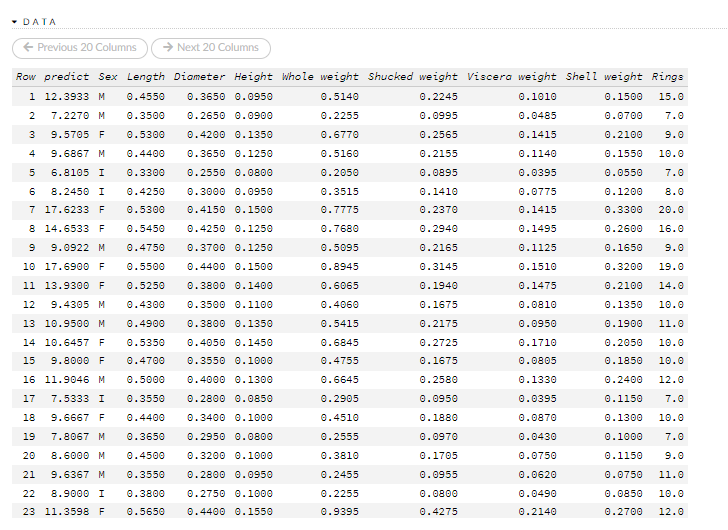
Abalones are marine snails. Their taxonomy puts them in the family Haliotidae, which contains only one genus, Haliotis, which once contained six subgenera.
The age of abalone is determined by cutting the shell through the cone, staining it, and counting the number of rings through a microscope -- a boring and time-consuming task. Other measurements, which are easier to obtain, are used to predict the age. Further information, such as weather patterns and location (hence food availability) may be required to solve the problem.
This dataset is usually used to predict the age of abalone from physical measurements.
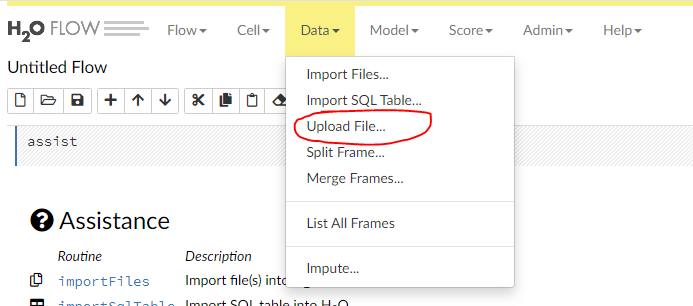
To upload a local file, click the Data menu and select Upload File....
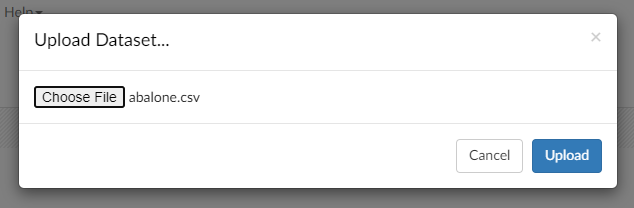
Click the Choose File button, select the file, click the Choose button, then click the Upload button.
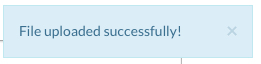
When the file has uploaded successfully, a message displays in the upper right and the Setup Parse cell displays.
Ok, now that your data is available in H2O Flow, let's move on to the next step: parsing. Click the Parse these files button to continue.
After you have imported your data, parse the data.
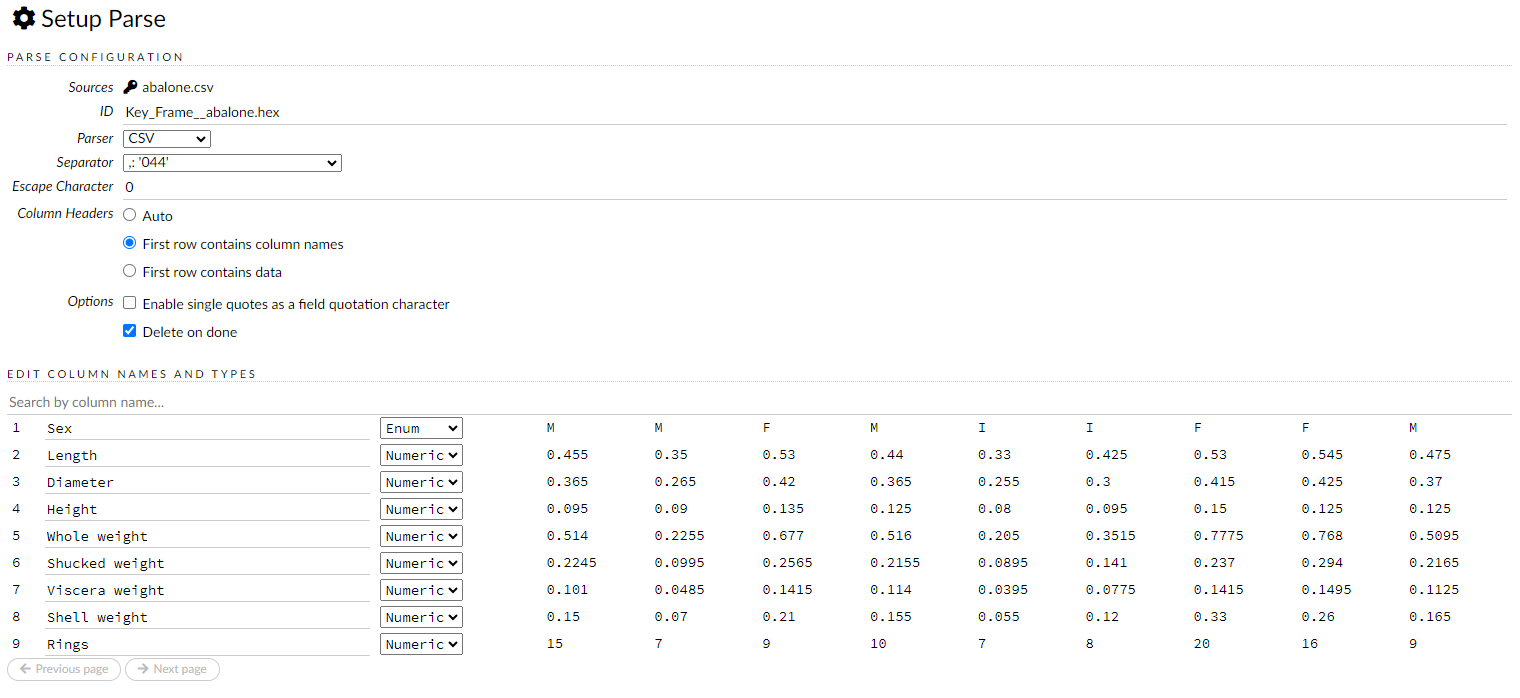
The read-only Sources field displays the file path for the imported data selected for parsing.
The ID contains the auto-generated name for the parsed data (by default, the file name of the imported file with .hex as the file extension). Use the default name or enter a custom name in this field.
Select the parser type (if necessary) from the drop-down Parser list. For most data parsing, H2O automatically recognizes the data type, so the default settings typically do not need to be changed. The following options are available:
SVMLight
Note: For SVMLight data, the column indices must be >= 1 and the columns must be in ascending order.
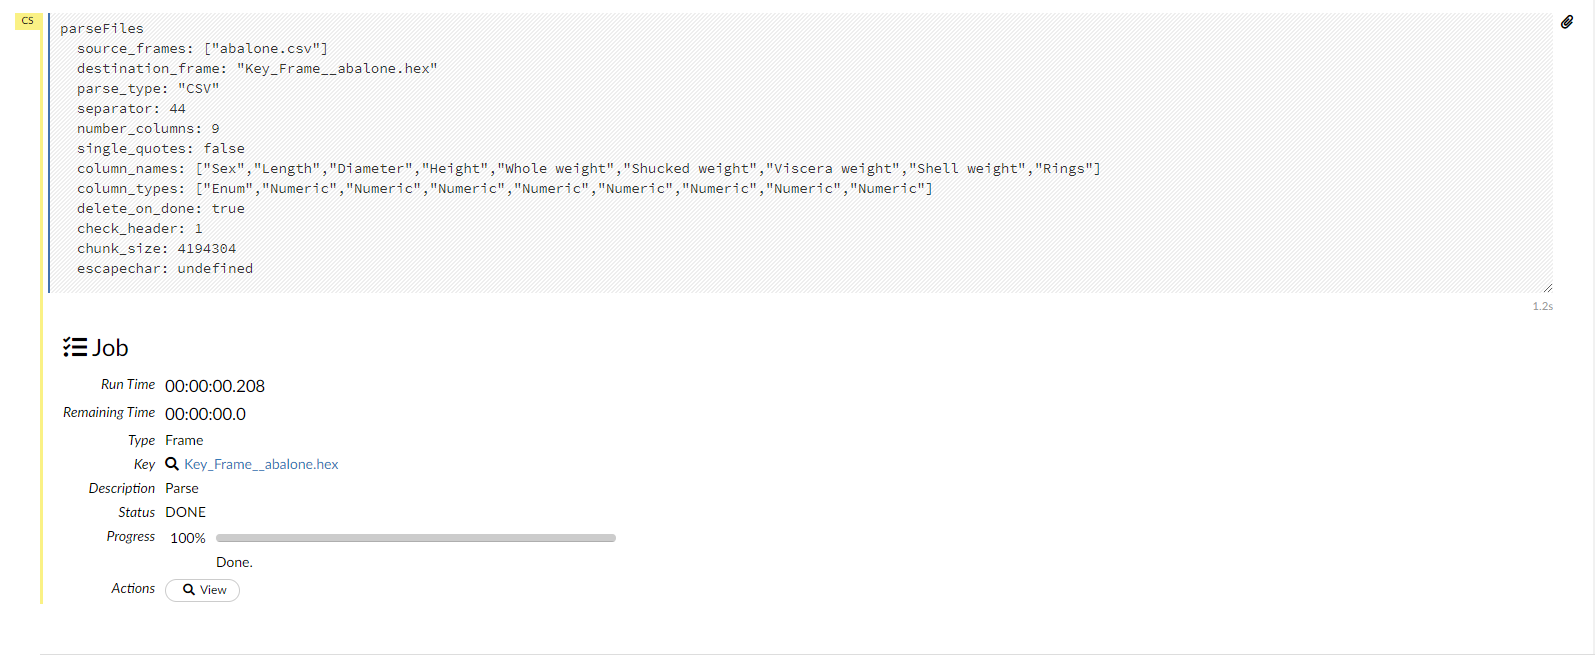
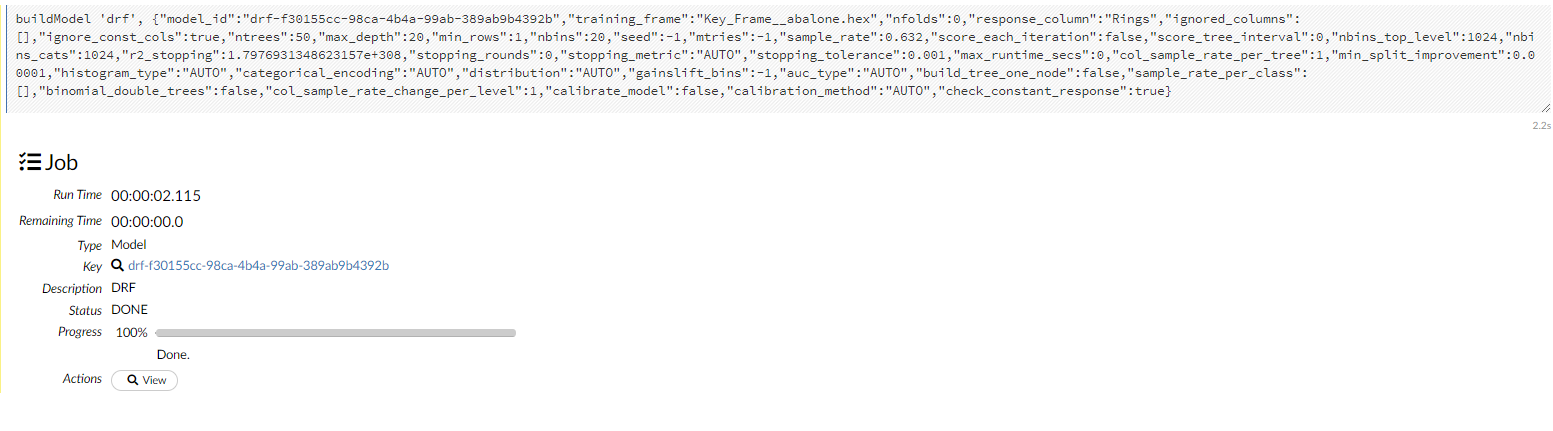
After you click the Parse button, the code for the current job displays.
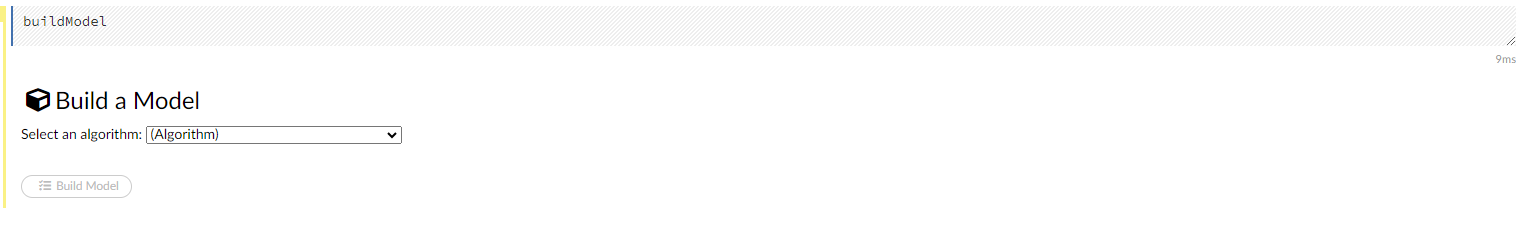
To build a model:
Click the Assist Me! button in the row of buttons below the menus and select buildModel
or
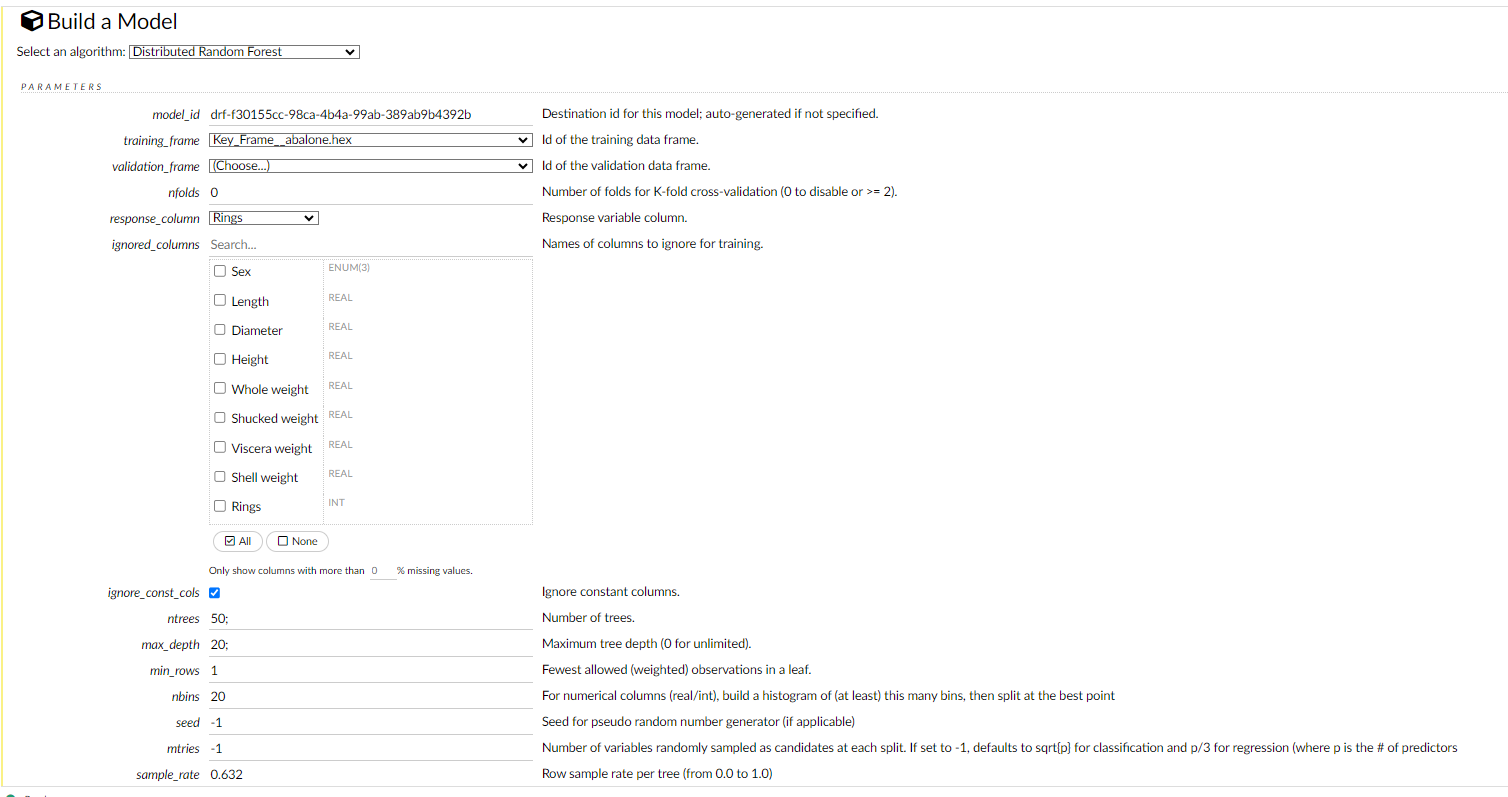
Click the View button after parsing data, then click the Build Model button
The Build Model... button can be accessed from any page containing the .hex key for the parsed data (for example, getJobs > getFrame). The following image depicts the K-Means model type. Available options vary depending on model type.
- Random Forest: Create a Random Forest model
Click the Assist Me! button, then click the getModels link, or enter getModels in the cell in CS mode and press Ctrl+Enter. A list of available models displays.
To view all current models, you can also click the Model menu and click List All Models.
To inspect a model, check its checkbox then click the Inspect button, or click the Inspect button to the right of the model name.
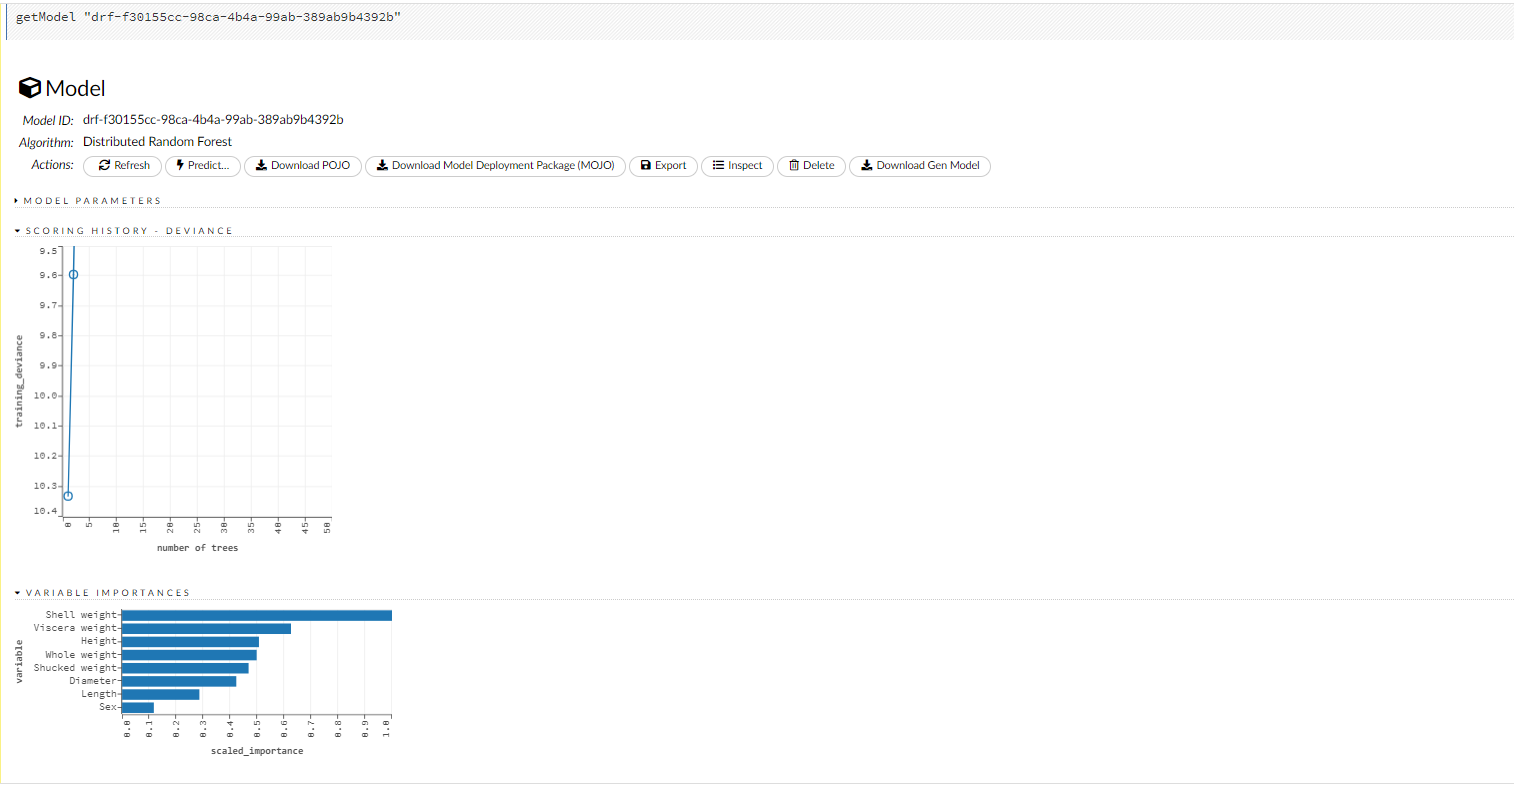
A summary of the model's parameters displays. To display more details, click the Show All Parameters button.
To delete a model, click the Delete button.
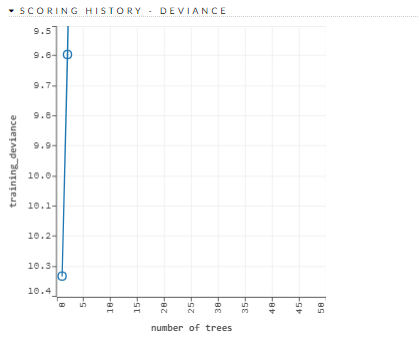
Scoring history: Represents the error rate of the model as it is built. Typically, the error rate will be higher at the beginning (the left side of the graph) then decrease as the model building completes and accuracy improves. Can include mean squared error (MSE) and deviance.
Variable importances: Represents the statistical significance of each variable in the data in terms of its affect on the model. Variables are listed in order of most to least importance. The percentage values represent the percentage of importance across all variables, scaled to 100%. The method of computing each variable's importance depends on the algorithm. To view the scaled importance value of a variable, use your mouse to hover over the bar representing the variable.
!Variable Importance](https://s3.amazonaws.com/weclouddata/images/h2o/h2oflowabaloneregression/StandardizedCentroids.png)
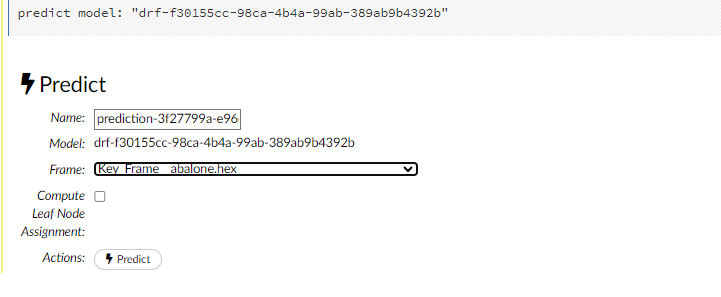
After creating your model, click the key link for the model, then click the Predict button. Select the model to use in the prediction from the drop-down Model: menu and the data frame to use in the prediction from the drop-down Frame: menu, then click the Predict button.
Click the Assist Me! button, then click the getPredictions link, or enter getPredictions in the cell in CS mode and press Ctrl+Enter. A list of the stored predictions displays.
To view a prediction, click the View button to the right of the model name.
You can also view predictions by clicking the drop-down Score menu and selecting List All Predictions.