Diving into Data and Presenting Discoveries with Streamlit and Pygwalker
Embark on an exhilarating expedition as we delve into the capabilities of Streamlit and Pygwalker in transforming data exploration and visualization. Prepare yourself for an immersive journey into the world of interactive data analysis!
Streamlit: Simplifying the Web App Development Experience
Streamlit, a dynamic Python library, empowers you to effortlessly convert your data scripts into interactive web applications. Say goodbye to the complexities of web development and coding challenges, as Streamlit enables you to rapidly build and share data-driven applications. It's the ultimate solution for swift, open-source, and free data application development.
Pygwalker: Unleashing the Potential of Data Analysis and Visualization
Pygwalker, a sought-after Python library, simplifies the process of data analysis and visualization. Built with data scientists and analysts in mind, Pygwalker allows you to generate captivating visualizations that include scatter plots, line plots, bar charts, and histograms with just a few simple drag-and-drop actions. Coding skills are no longer a prerequisite to creating visually captivating and meaningful narratives!
Visit the Pygwalker GitHub Page to explore additional examples and resources.
Streamlit and Pygwalker: A Comprehensive Integration
Before embarking on your enthralling data exploration adventure, ensure that you have a Python environment (version 3.6 or higher) set up on your computer. Once you've completed this step, follow the straightforward instructions below:
Install the Required Dependencies
Launch your command prompt or terminal and execute the following commands to install the necessary dependencies:
pip install pandas
pip install pygwalker
pip install streamlit
Incorporate Pygwalker in Your Streamlit Application
Now that all the dependencies are in place, create a new Python script called pygwalker_demo.py and insert the following code:
import pygwalker as pyg
import pandas as pd
import streamlit.components.v1 as components
import streamlit as st

# Configure the Streamlit page
st.set_page_config(
    page_title="Using Pygwalker with Streamlit",
    layout="wide"
)

# Add a captivating title
st.title("Using Pygwalker with Streamlit")

# Import your dataset
df = pd.read_csv("https://sample.csv")

# Generate the HTML output using Pygwalker
pyg_html = pyg.walk(df, return_html=True)

# Embed the resulting HTML into the Streamlit app
components.html(pyg_html, height=1000, scrolling=True)
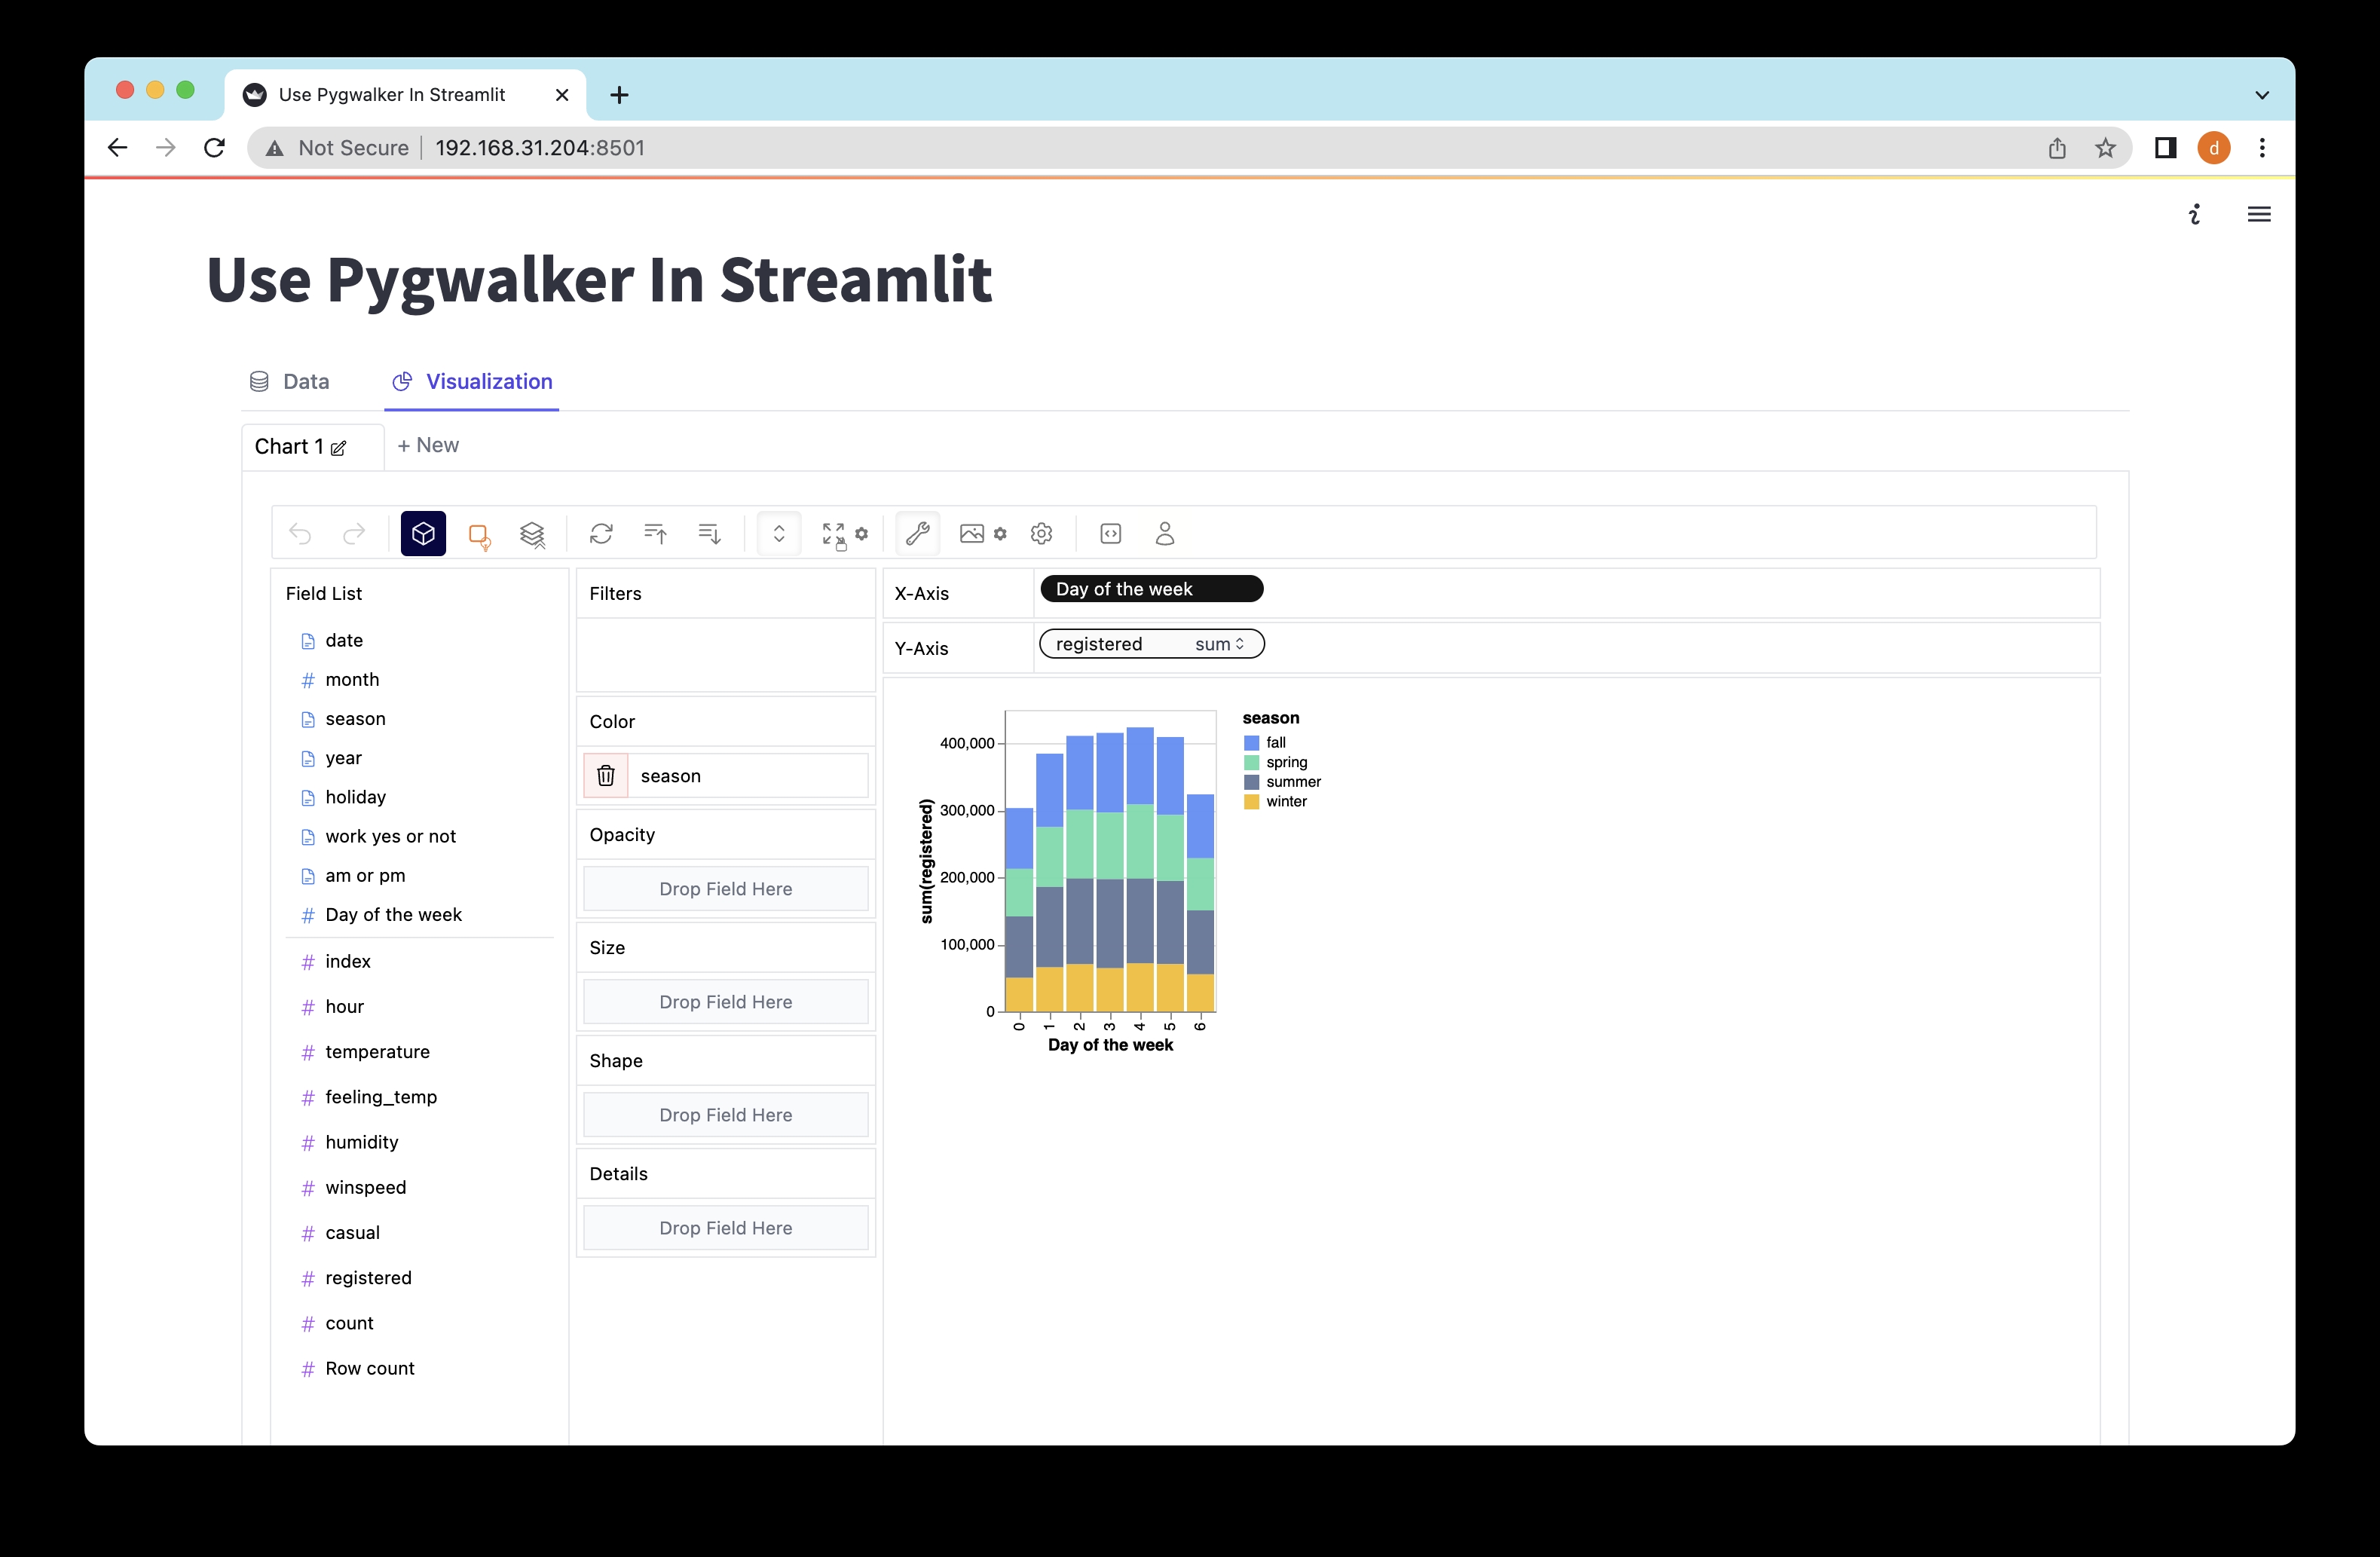
Data Exploration with Pygwalker in Streamlit
Explore Data with Pygwalker in Streamlit
To launch the Streamlit application and commence your thrilling data exploration journey, execute the following command in your command prompt or terminal:
streamlit run pygwalker_demo.py
Look out for the following information displayed:
Access the Streamlit app in your web browser using the following URL:
Local URL: http://localhost:8501
Network URL: http://xxx.xxx.xxx.xxx:8501
Glimpse the power of Pygwalker's intuitive drag-and-drop actions for interactive data exploration and visualization by visiting the provided URL: http://localhost:8501
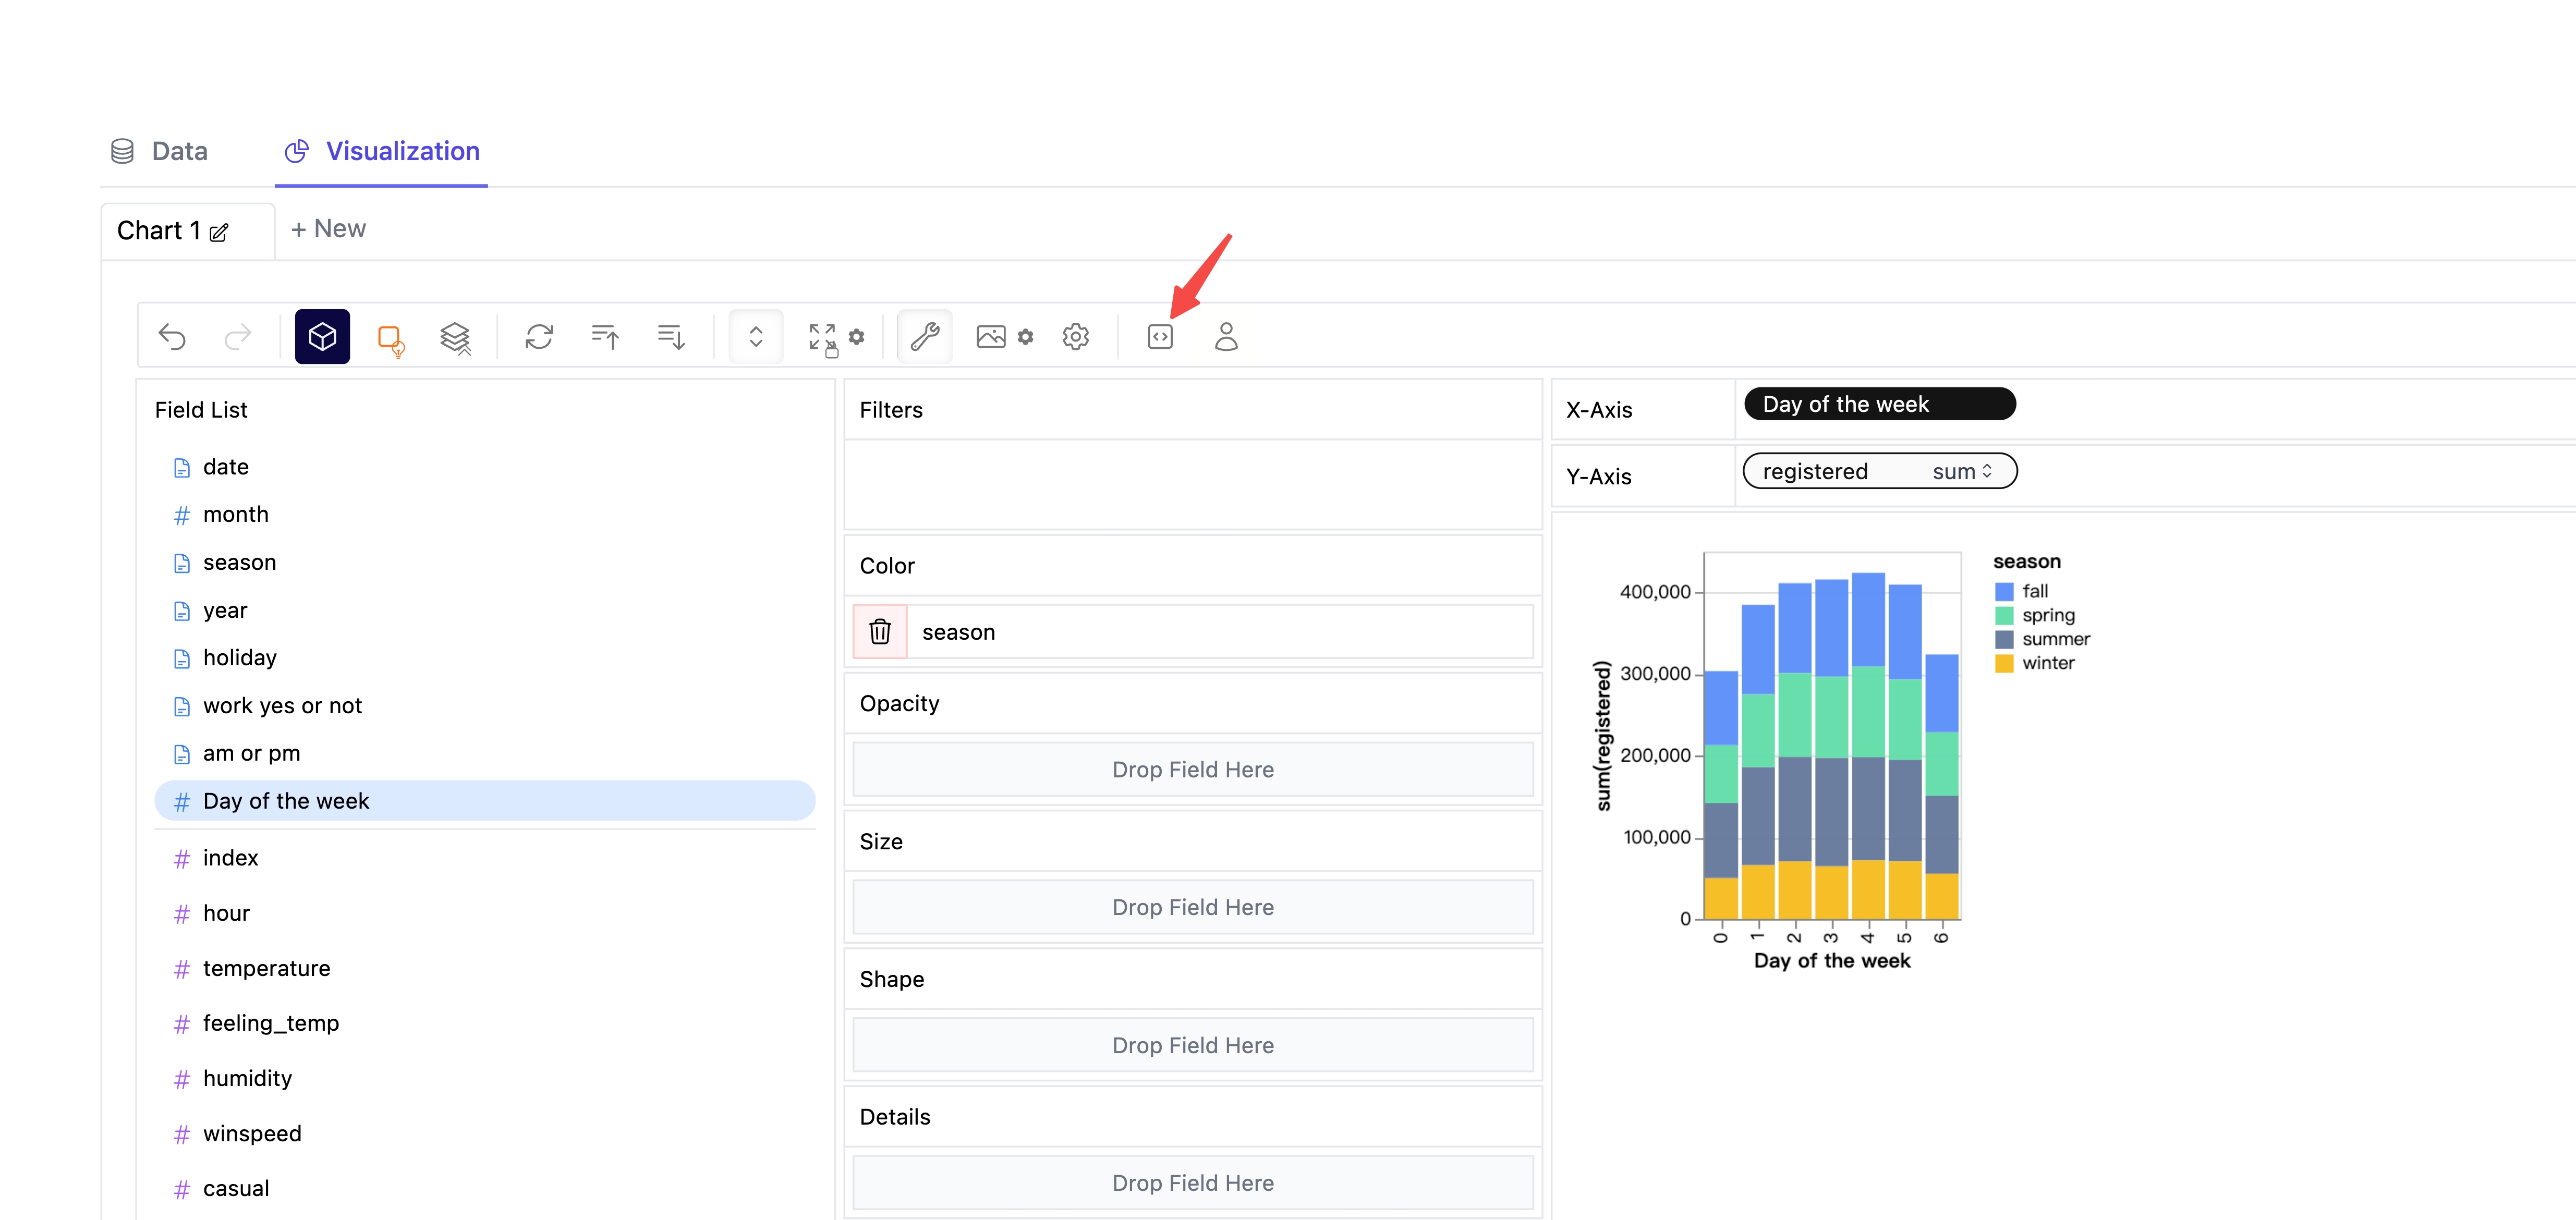
Preserve the State of Your Pygwalker Chart
If you wish to save the state of your Pygwalker chart, follow these simple steps:
- Click the export button on the chart.
- Click the copy code button.
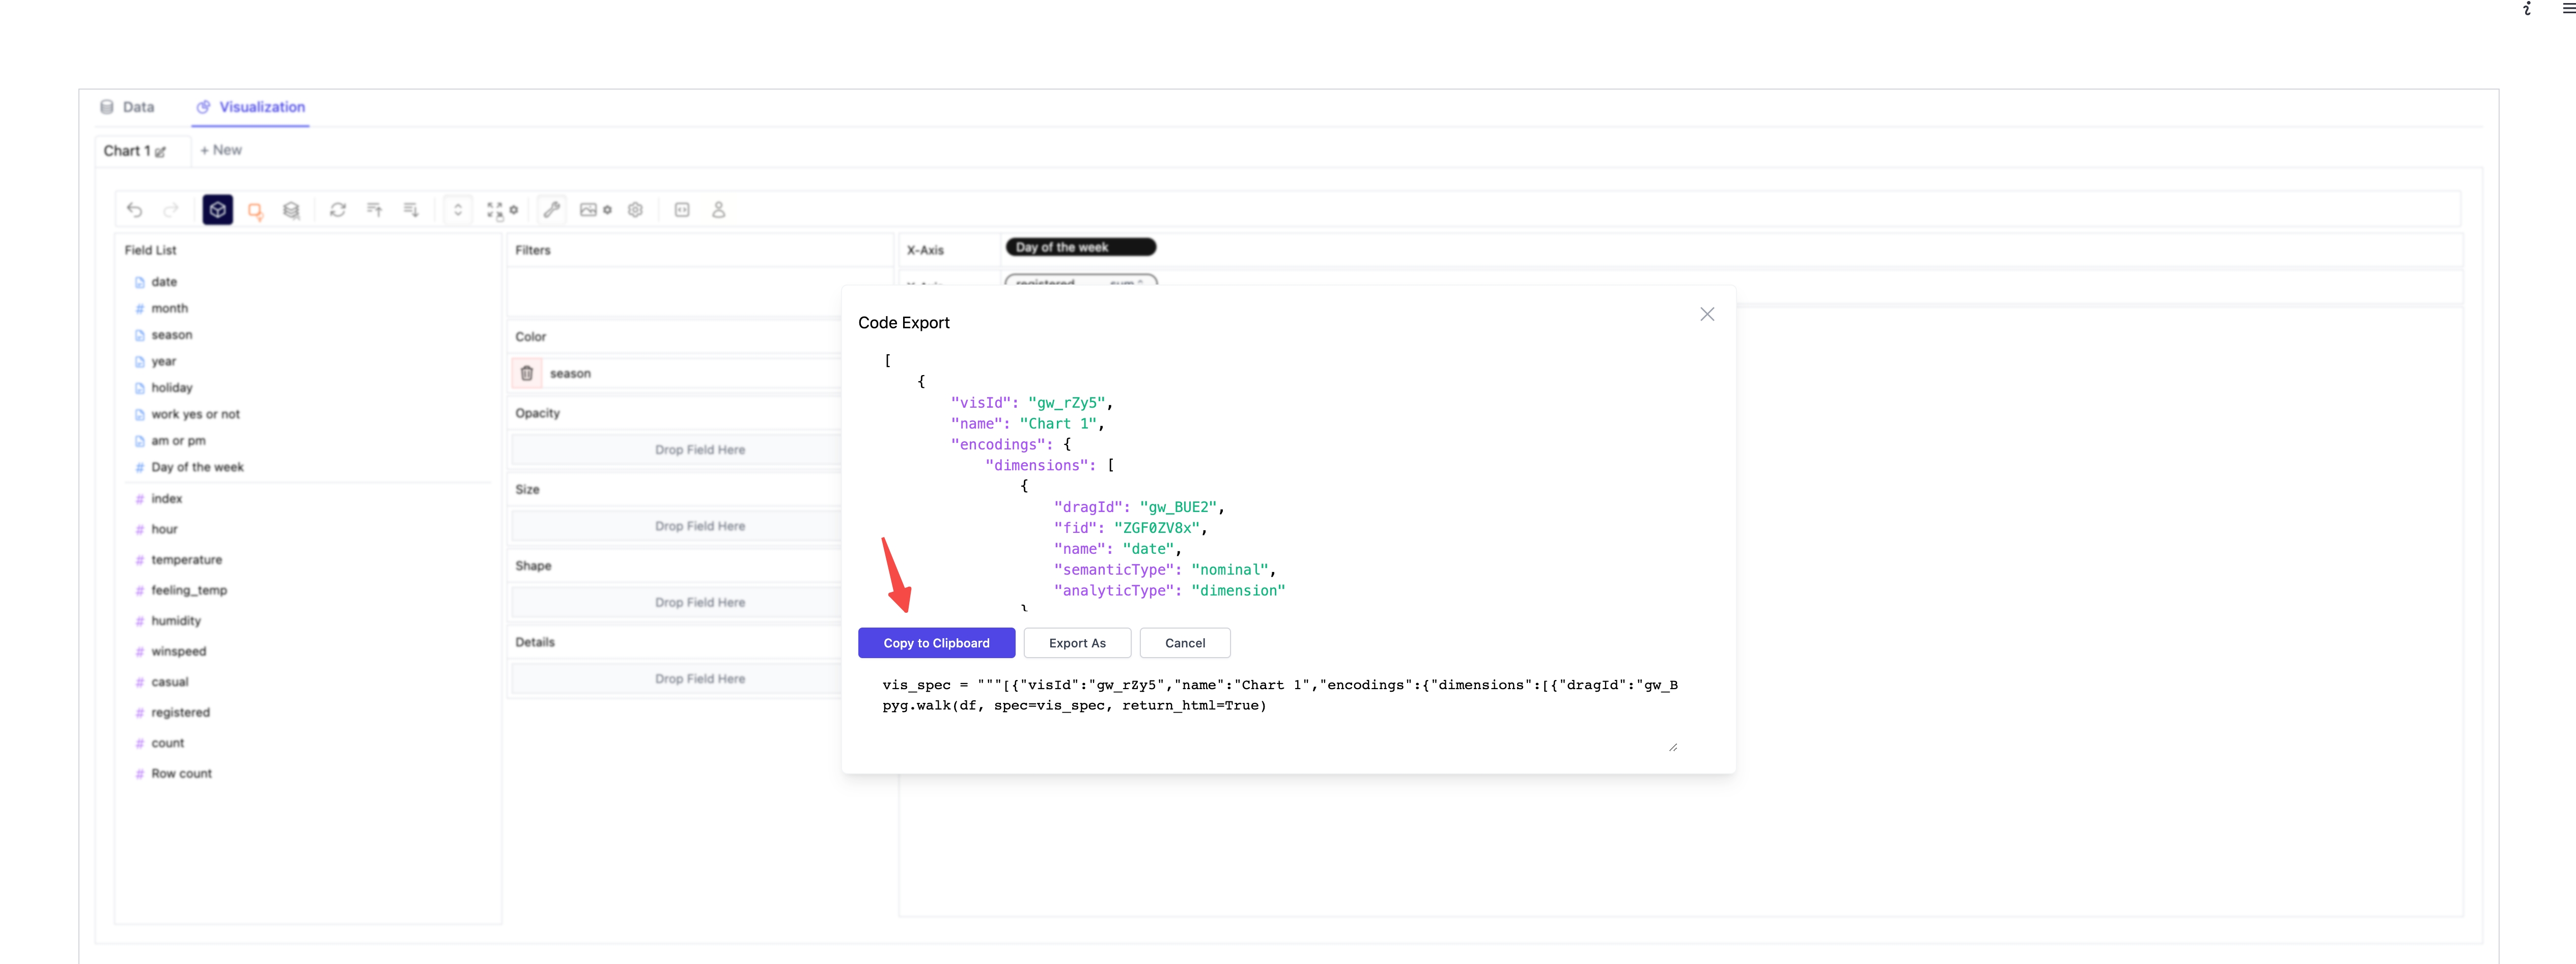
- Paste the copied code into your Python script at the desired location.
import pygwalker as pyg
import pandas as pd
import streamlit.components.v1 as components
import streamlit as st

# Configure the Streamlit page
st.set_page_config(
    page_title="Using Pygwalker with Streamlit",
    layout="wide"
)

# Add a captivating title
st.title("Using Pygwalker with Streamlit")

# Import your dataset
df = pd.read_csv("sample.csv")

# Paste the copied Pygwalker chart code here
vis_spec = """"""

# Generate the HTML output using Pygwalker
pyg_html = pyg.walk(df, spec=vis_spec, return_html=True)

# Embed the resulting HTML into the Streamlit app
components.html(pyg_html, height=1000, scrolling=True)
Remember to refresh the web page to observe the saved state of your Pygwalker chart.
Pygwalker is built upon graphic-walker, making it embeddable in various platforms such as Excel and Airtable. This vast compatibility allows your Pygwalker application to seamlessly collaborate with users across diverse environments, harnessing the full potential of graphic-walker/pygwalker.
Conclusion
Streamlit and Pygwalker are invaluable tools that streamline data exploration and enhance the communication of impactful insights.
Streamlit's user-friendly interface combined with Pygwalker's intuitive visualization options work in harmony to enhance your data analysis workflow. Set forth into your data realms, uncover hidden treasures, and share your remarkable discoveries with the world!