To debug an application:
1. Compile and build your new project.
Make sure that the binary file generated has the name m2mapz.bin set by default because Lauterbach only loads m2mapz.bin files.
2. Connect the Debugger with a JTAG header attached to your computer using USB.
3. Power on the debugger.
4. Connect JTAG debugger cable to the Telit module that you want to debug.
5. Turn on your Telit module.
6. Launch your setup debug on Eclipse and select Debug Perspective.
When Eclipse communicates with the Telit module, the T32 software is automatically called and executed. The communication is performed through debugger and USB cable via Semi-hosting.
You can send an AT command (at+m2m=4,10) to the device when you turned it on to inform it to execute the AppZone application if the application is not configured to start automatically.
If the Telit module is running and already configured to start the AppZone user application, the SDK automatically resets the module and starts the application.
If the Telit module is not configured to auto-start the AppZone user application, the user application does not start until an AppZone activation command is sent to the module (such as: at+m2m=4,10. …)
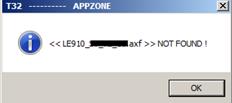
If a T32 error message such as the following appears:
Contact Telit support for an updated symbol file to debug the module. The symbol file is located in the following folder:
..\IoT_AppZone_IDE\eclipse\plugins\com.appzonec.plugin.prebuilt_<version>\lauterbach\APPZONE\axf )
Where <version> is the AppZone version.
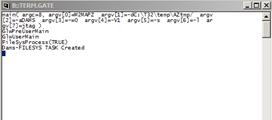
To set breakpoints when T32 is running, wait at least until you see some messages in the T32 TERM:GATE window to ensure that communication with Eclipse is not lost.
The following figure shows an example of a TERM:GATE window:
When you launch additional debug sessions, the breakpoints are not set automatically. You must set the breakpoints again for each session.
You can set breakpoints in Eclipse or in T32 because they are automatically synchronized.
The following figure displays synchronized breakpoints:

You can display files in both Eclipse and T32.
•In Eclipse, right-click the source file and then select Open In Trace32.
•In Trace32, right-click in the List window and then select Edit Source.

To terminate a debug session, In Eclipse
Debug Perspective click the stop button ( ).
).
We recommend that you do not close Trace32 to refrain from resetting it, which is time consuming.
If a message appear to reset the device and connect, click Yes.
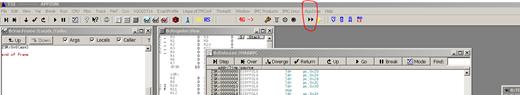
To relaunch the current section using Trace32 only, click the following icon: