The AWS Signal Corps has built the beginning of a data lake, but their colony was infected before they could finish. In this workshop, we pick up where they left off.
We discover and organize the various datasets using AWS Glue, query against them using Amazon Athena, and empower business users through Amazon QuickSight to analyze the data without having to write SQL.
Because some of the data being streamed into the data lake is coming in real time through Amazon Kinesis Firehose, we add real-time analytics using Kinesis Analytics.
Lastly, we run Spark analytics using Amazon EMR, which is connected to the AWS Glue Data Catalog.
In this section you will use the CloudFromation template to create the following
Amazon KinesisFirehose to deliver the simulated to Amazon S3.
Open the Amazon CloudFormation Console with Template
This will open cloudformation and auto fill the template:
https://s3.amazonaws.com/serverless-analytics/zombie-datalake/deploy.yaml
Click Next
The previous organization started to build a Data Lake, but it really turned into a data swamp. The survivors were quickly overrun by zombies and weren't able to categorize and make the data discoverable to have analytics run against them.
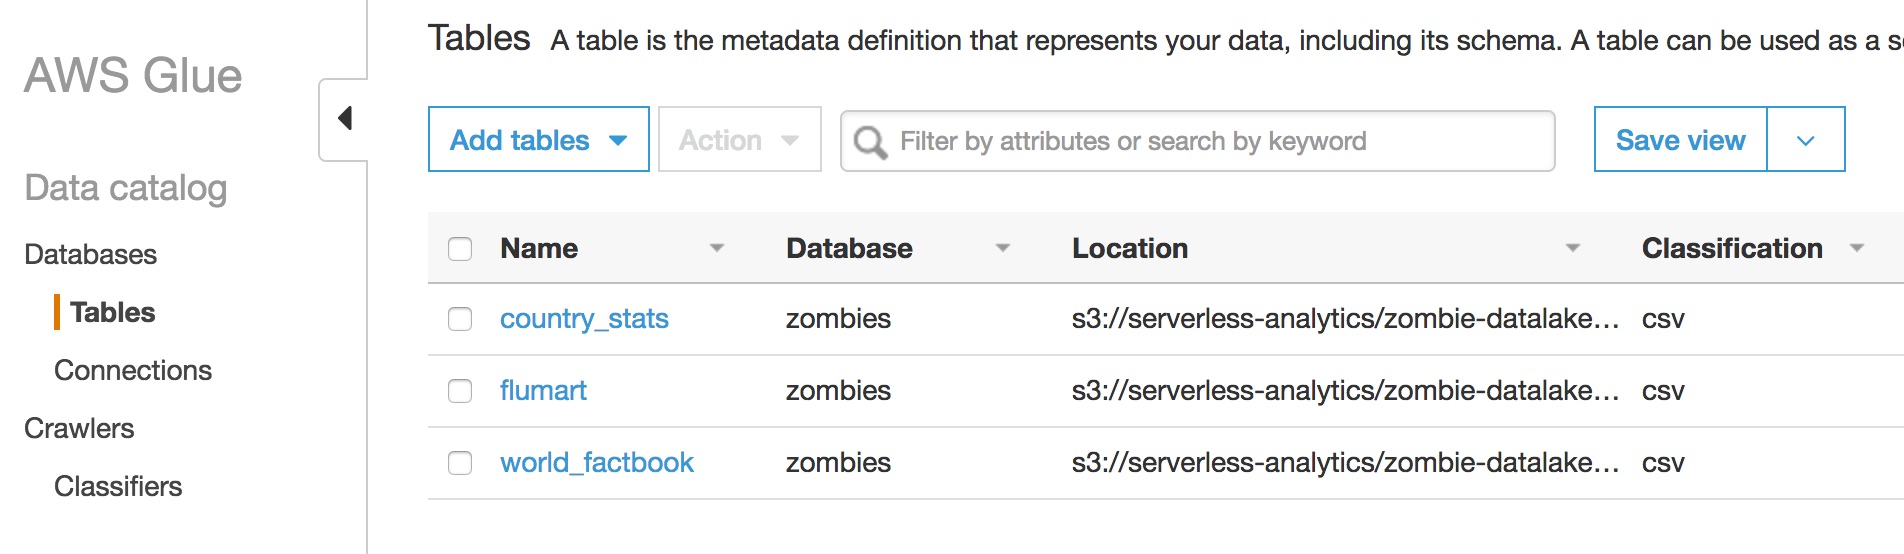
In this section, we'll first discover and organize the data by automatically crawling the data sources uses AWS Glue. The crawling will allow us initially create a catalog of what data exists, what the datasets contain, how to read the datasets and where to access it. The crawlers will also automatically maintain the metadata for us it adjusts to changes in the Lake.
Next -- you will help survivors start to query and analyze the data using Amazon Athena. We'll query against the virus data, survivor stats, and other information such as weather and population to perform descriptive analytics.
Fill out the add crawler wizard.
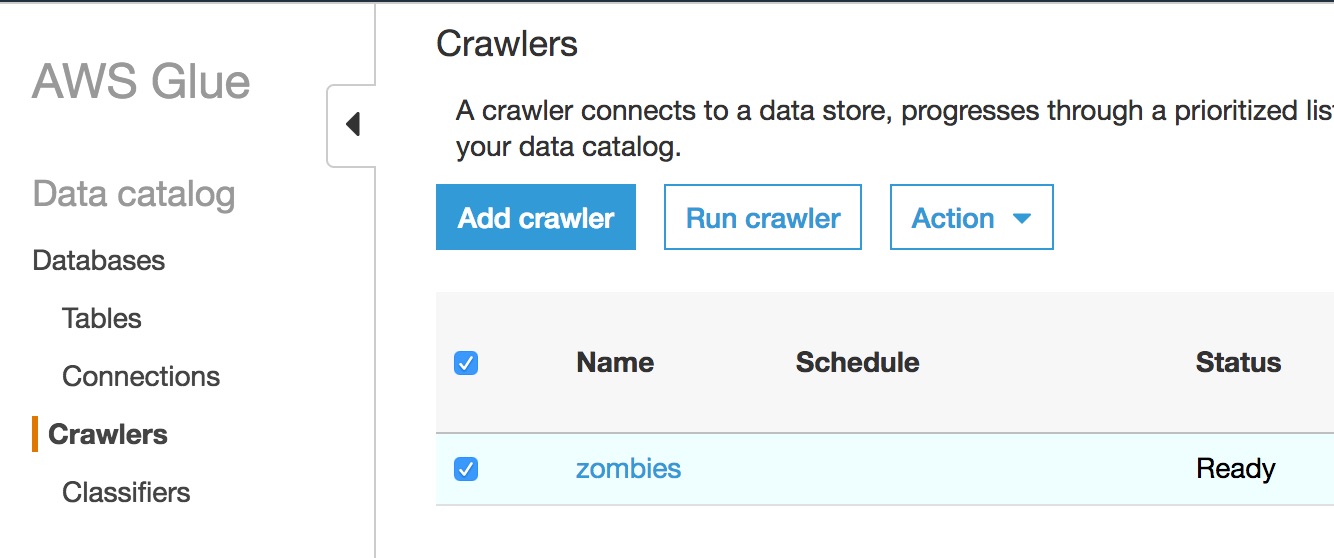
Select the new crawler and click Run crawler.
Navigate to the Amazon Athena Console.
Amazon Athena
Select zombie_annihilation under DATABASE
Execute the following queries
SELECT *FROM flumart limit 10;
SELECT *FROM flumartWHERE DATE '2015-12-21' BETWEEN sdate AND edate;
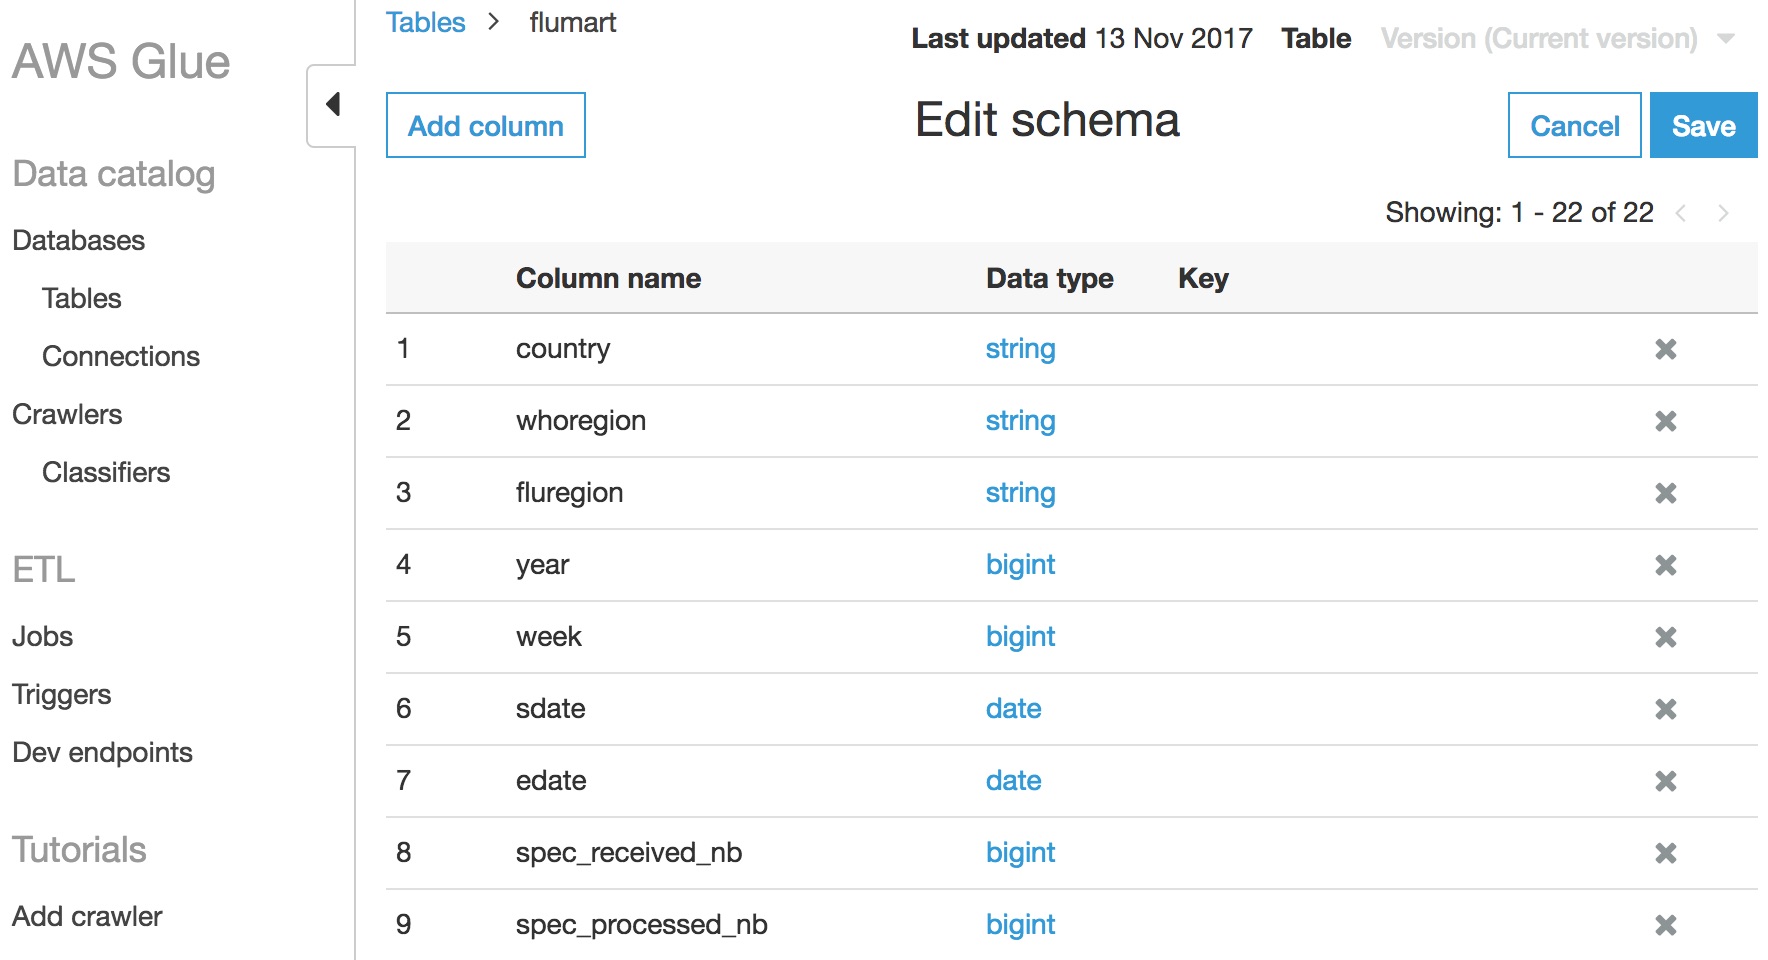
For the second query we get an error since Athena thinks sdate and edate varchars not dates.
flumart Schemasdate and update it to DATE.edate.Click Save
Next, Select Compare Versions in the console to see the changes we made in the Table.
SELECT *FROM flumartWHERE DATE '2015-12-21' BETWEEN sdate AND edate;
Let's first query the flu data -- notice when we query -- we don't need to know anything about the underlining storage formats.
SELECT country, SUM(all_inf) AS infectionsFROM flumartWHERE sdate > DATE '2017-01-01'GROUP BY countryORDER BY infections DESC;
We can also join multiple datasets together, each could be in different formats.
SELECT flu.country, 1.0 * infections / population * 10e6 AS inf_per_mmFROM world_factbookINNER JOIN (SELECT flumart.country, SUM(flumart.all_inf) AS infectionsFROM flumartWHERE flumart.sdate > DATE '2017-01-01'GROUP BY flumart.countryORDER BY infections DESC) fluON flu.country = world_factbook.countryORDER BY inf_per_mm DESC;
Fill out the Add job wizard
Click Save then Run job and Run job again.
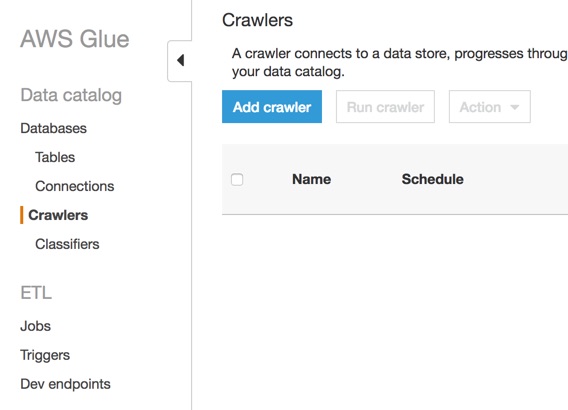
Navigate to the Crawlers section of the AWS Glue console. Click the Add crawler button.
Fill out the add crawler wizard.
Select the new crawler and click Run crawler.
Now that we know what data exists and how to access it, we want to get the help of all the survivors to start analyzing the data. Unfortunately, some of the survivors aren't technical and asking them to perform queries using SQL or writing code won't work.
Amazon QuickSight is going to help us here.
In this activity, you'll create a set of datasets within QuickSight that uses the Glue Data Catalog and Athena as a backend. This enables these users to easily query the data in S3, but not have to understand the raw data formats, how to read the data, or how to write SQL.
These non-technical users will then be able to create a set of dashboard to help us understand the zombie movements better.
Let’s create the various datasets that we’ll visualize.
Bring up QuickSight
In the top right, select “Manage data”

Now select “New data set” in the top left corner
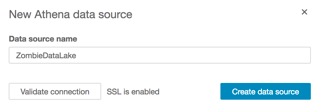
From New Data Sources, Select “Athena”
Select “Create Data Source”
Now we’ll use that datasource to create a dataset
Select the Database that we were using in the first lab, and then select the world_factbook table.
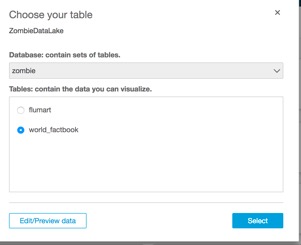
And hit the “Select” button on the right.
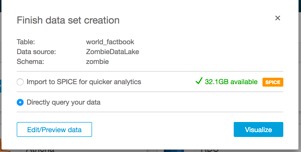
Select the query directly and the “Visualize” option
Building our first visualizations:
On the left hand side, you’ll notice each field for the table or dataset we just created:
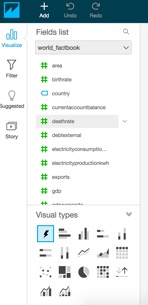
Go ahead and select the “country”, “naturalgasproduction”, and “oilproduction” fields.
This will show a visualization that looks like this:
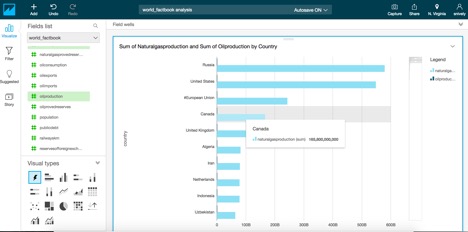
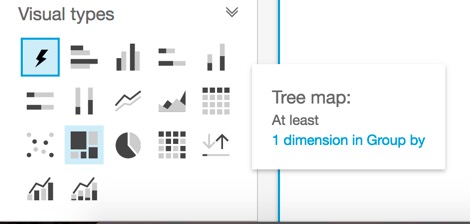
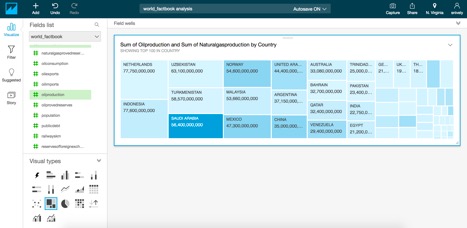
Notice it automatically selected a chart type. Suppose we wanted to see this as a treemap view, let’s select that under Visual Types:
And now you should see a chart where the size is the amount of naturalgas produced and the color is the amount of oil produced in each country.
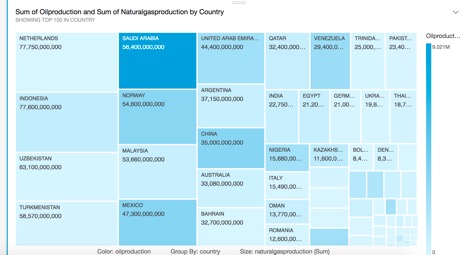
Across the bottom of the visualization (when the browser is maximized), you’ll see it called out here:

Next, let’s resize this visual to only take the top half of the display. Click and hold the resize icon in the bottom left of the visual and drag
Now let's create a new dataset in QuickSight, joining the factbook and flu data together. We'll calculate the amount of flu, based on the population of the regions.
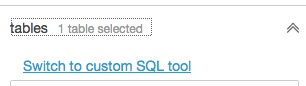
Now select custom SQL tool under the Tables section:
Enter in ZombieRegionTrend for the SQL name and the following SQL:
SELECT flu.sdate, flu.whoregion as region, 1.0 * sum(flu.all_inf) / sum(population) * 10e6 AS inf_per_mmFROM zombie_annihilation.world_factbook wfjoin zombie_annihilation.flumart flu on (flu.country = wf.country)group by sdate, whoregion
Save it as the name "ZombieRegionTrend" and Select "Save"

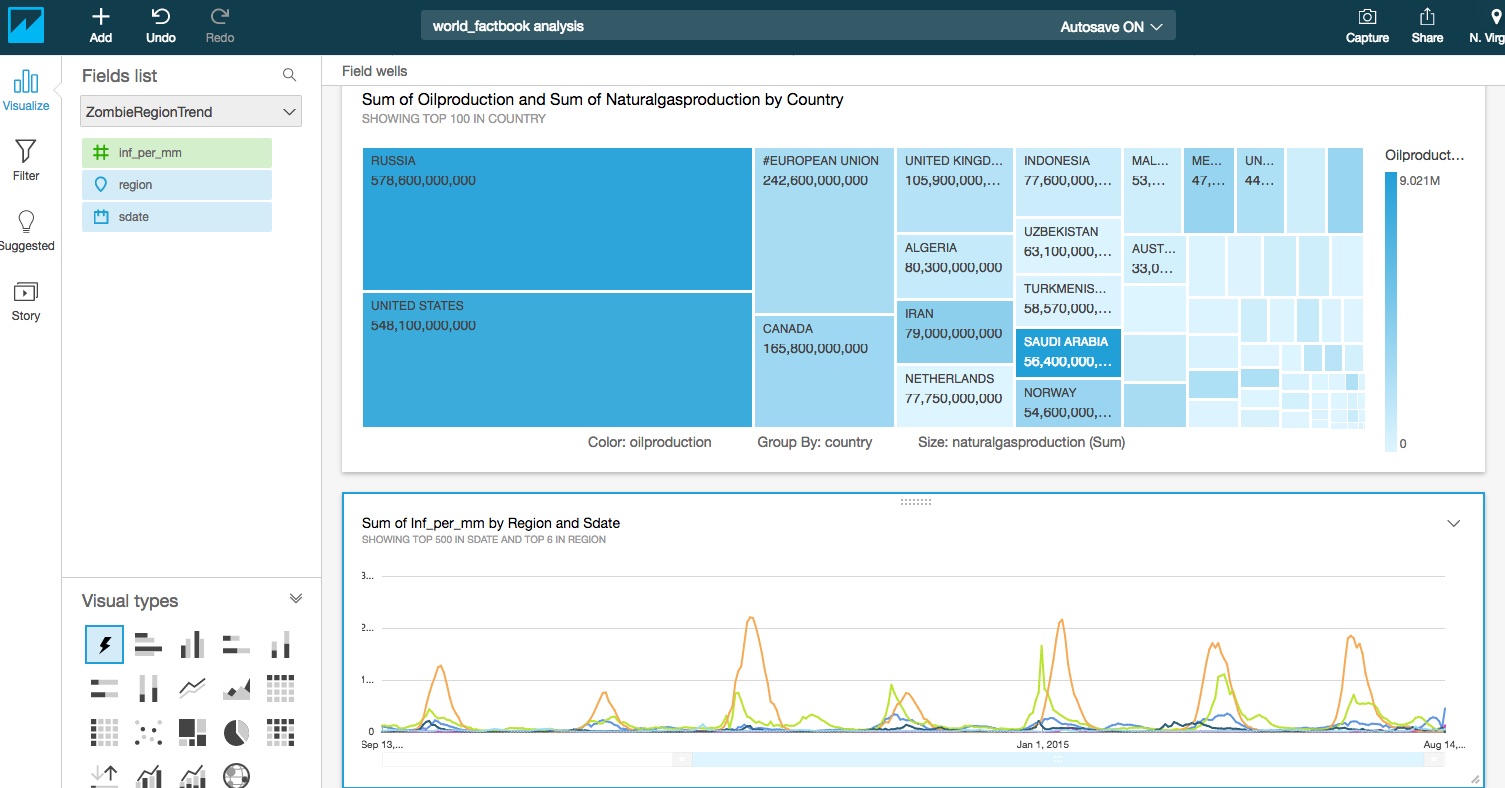
Now we'll add this new dataset to the existing analysis we were doing...
Select the drop down for world_factbook, and select Edit Data sets

Select "Add data set"
Now we can have multiple datasets on one analysis.. Let's start visualizing this now tool
resize the visualization so you can see both chats on the same display:
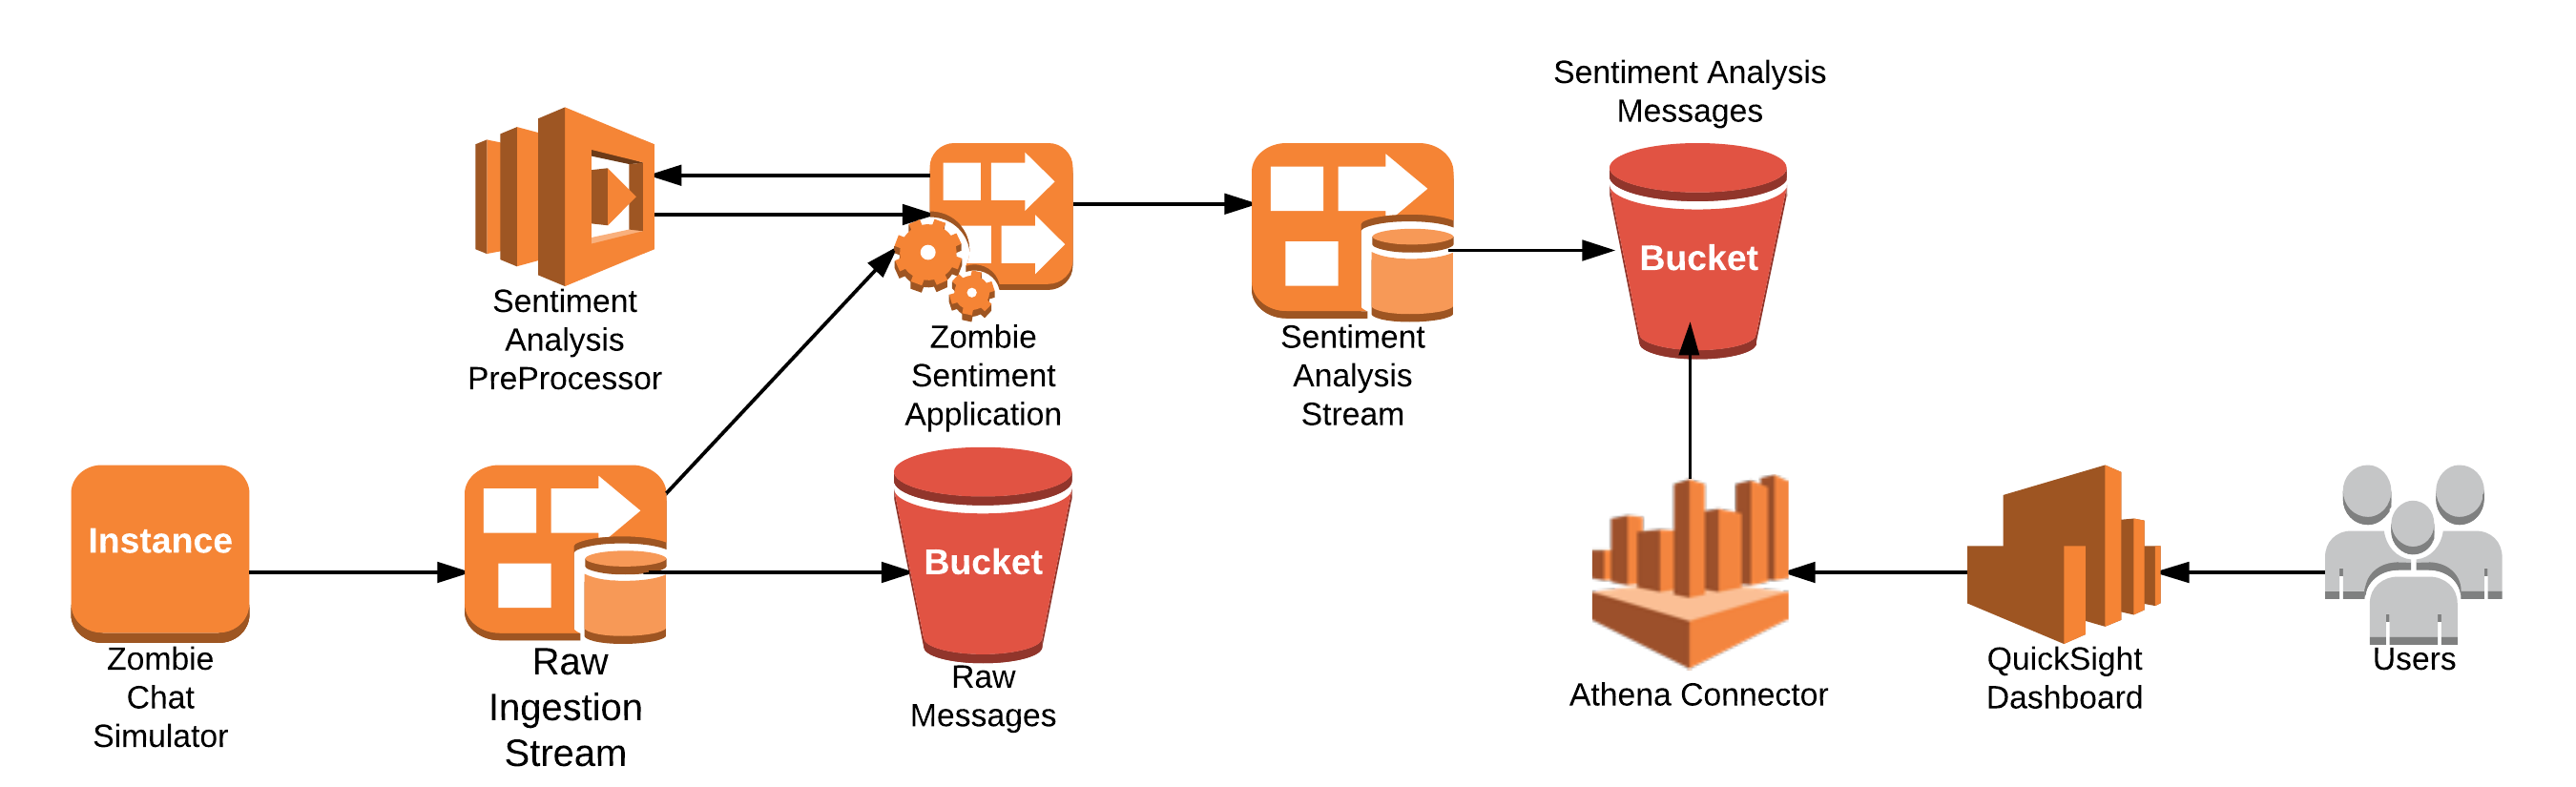
In Part 3 we are going to be looking at the chat events coming into the chat application from the Zombie Apocalypse workshop. Messages are being sent from people across the globe informing each other of the status of their countries and the level of infection. In this simulation, events are being streamed to a kinesis firehose delivery stream that you will build a Kinesis Analytics application on top of to evaluate and aggregate the sentiment value of the messages and push to another delivery stream to persist to S3.
At this point the deployment of the CloudFormation template should be complete and all resources deployed. There is a simulator API deployed to the EC2 instance. We are going to validate it is up and running and will start it.
To validate the simulator is running you can open in the browser:
http://<ec2-public-ip>:8080/health
This will return the health of the endpoint and you should se a status of:
To start and stop the simulator you can:
# go tohttp://<ec2-public-ip>:8080/swagger-ui.html
Click on either start/stop simulator
All application logs for the simulator get pushed to CloudWatch logs in a logging group zombie-chat-simulator.
The components of the Zombie Annihilation simulator consist of:
You will be creating in this lab:
(Extra Credit) QuickSight dashboard showing number of negative messages by geographic location.
Now that the simulator is running we want to validate the records are flowing to the kinesis stream. Follow the steps below to validate.
The first task is to create the Kinesis Firehose for which the output of the Kinesis Analytics Application will use. This application will use a Lambda function to pre-process the records coming into the Kinesis Analytics Application and you will be writing SQL to aggreagte the Positive, Negative, and Total counts by Country and sending them to a Kinesis Firehose destination.
To create the destination Kinesis Firehose for the Analytics application follow the instructions below:
Once you have the delivery stream created and we have validated records are streaming to the source stream we can create the Kinesis Analytics application.
To get started from the AWS console go to Kinesis and select Kinesis Analytics.
In the SQL text box replace the existing text with the SQL below:
-- Creates an output stream and defines a schemaCREATE OR REPLACE STREAM "DESTINATION_SQL_STREAM" (INGEST_TIME timestamp,COUNTRY VARCHAR(140),LATITUDE DOUBLE,LONGITUDE DOUBLE,NEGATIVE_COUNT INTEGER,POSITIVE_COUNT INTEGER,MESSAGE_COUNT INTEGER);CREATE OR REPLACE PUMP "STREAM_PUMP" AS INSERT INTO "DESTINATION_SQL_STREAM"SELECT STREAM STEP("SOURCE_SQL_STREAM_001".ROWTIME BY INTERVAL '30' SECOND) AS "ingest_time","country", "latitude", "longitude",COUNT(CASE WHEN "sentiment" = 'negative' THEN 1 ELSE NULL END) as NEGATIVE_COUNT,COUNT(CASE WHEN "sentiment" <> 'negative' THEN 1 ELSE NULL END) as POSITIVE_COUNT,COUNT(*) AS MESSAGE_COUNTFROM "SOURCE_SQL_STREAM_001"GROUP BY "country", "latitude", "longitude",STEP("SOURCE_SQL_STREAM_001".ROWTIME BY INTERVAL '30' SECOND);
Click "Save and Continue"
Looking at the SQL you can see it looks very much like ANSI SQL. The differences occur on how the Kinesis Analytics Application can process and continuous stream of data. It can do this by creating a series of STREAMs and PUMPs. The STREAM can parse the data coming into the application and the PUMP is a way to move aggregates of data over time to be evaluated. In this example we are creating a "DESTINATION_SQL_STREAM" STREAM to send the aggregates. We will analyize the the streaming data coming in every 30 seconds and write a record out to the destination stream. This destination stream will persist the data to S3 to be used in your data lake to determine the spread of zombie infection based on the analysis of messages coming in from each country.
Let the analytics application run for a few minutes and check S3 to ensure you have data in the sentiment prefix of the working bucket.
Fill out the add crawler wizard.
Select the new crawler and click Run crawler.
This is going to create the zombie_sentiment table in the zombie_annihilation database in the Glue Data Catalog. We will use this table with the Athena connector in QuickSight to visualize the zombie infection spreading across the globe.
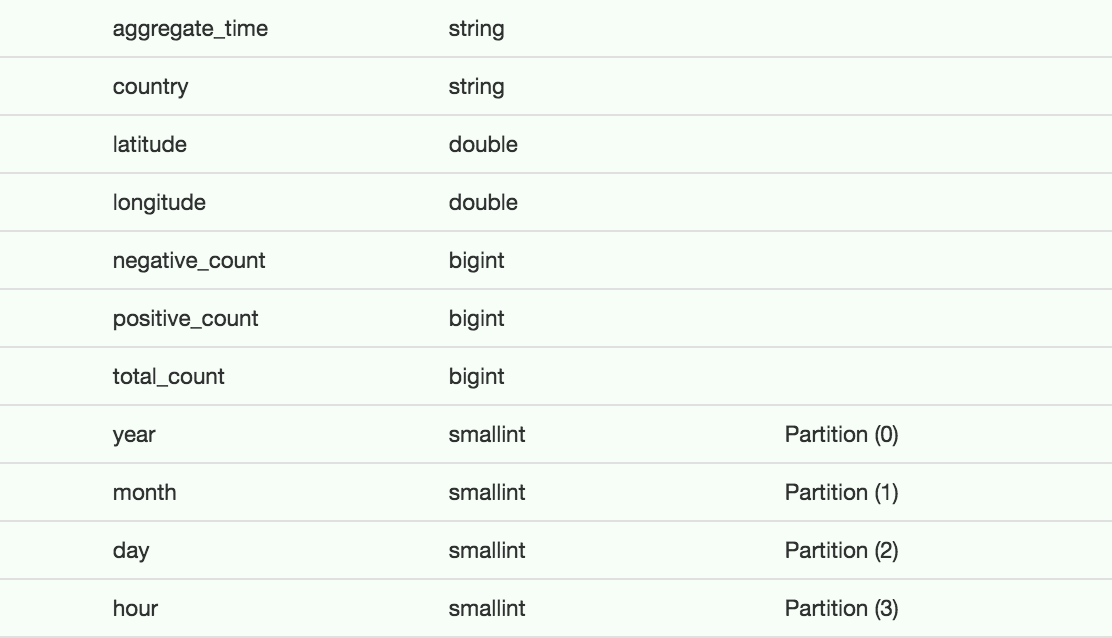
When Glue discovers the sentiment data it cannot infer the column names from the Kinesis Analytics application. You will need to click on the table in the Glue console and click "Edit Schema". The schema of the table should look like:
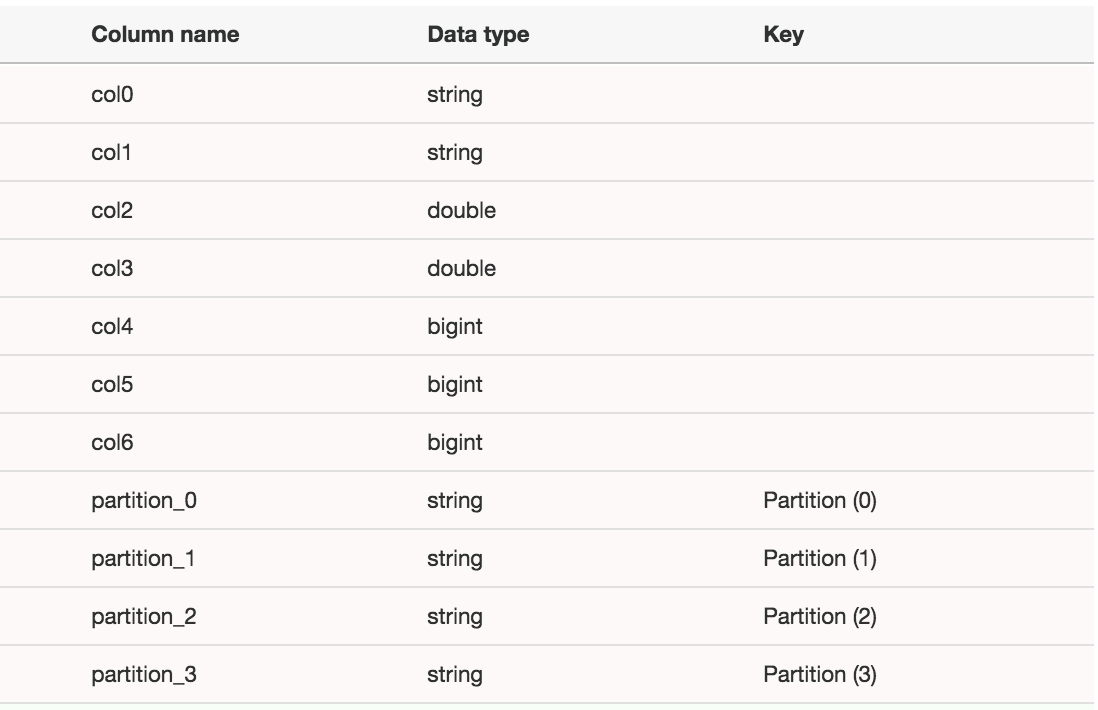
You will make the changes to look like:
Verify the table is created and validate you can query the table with Athena.
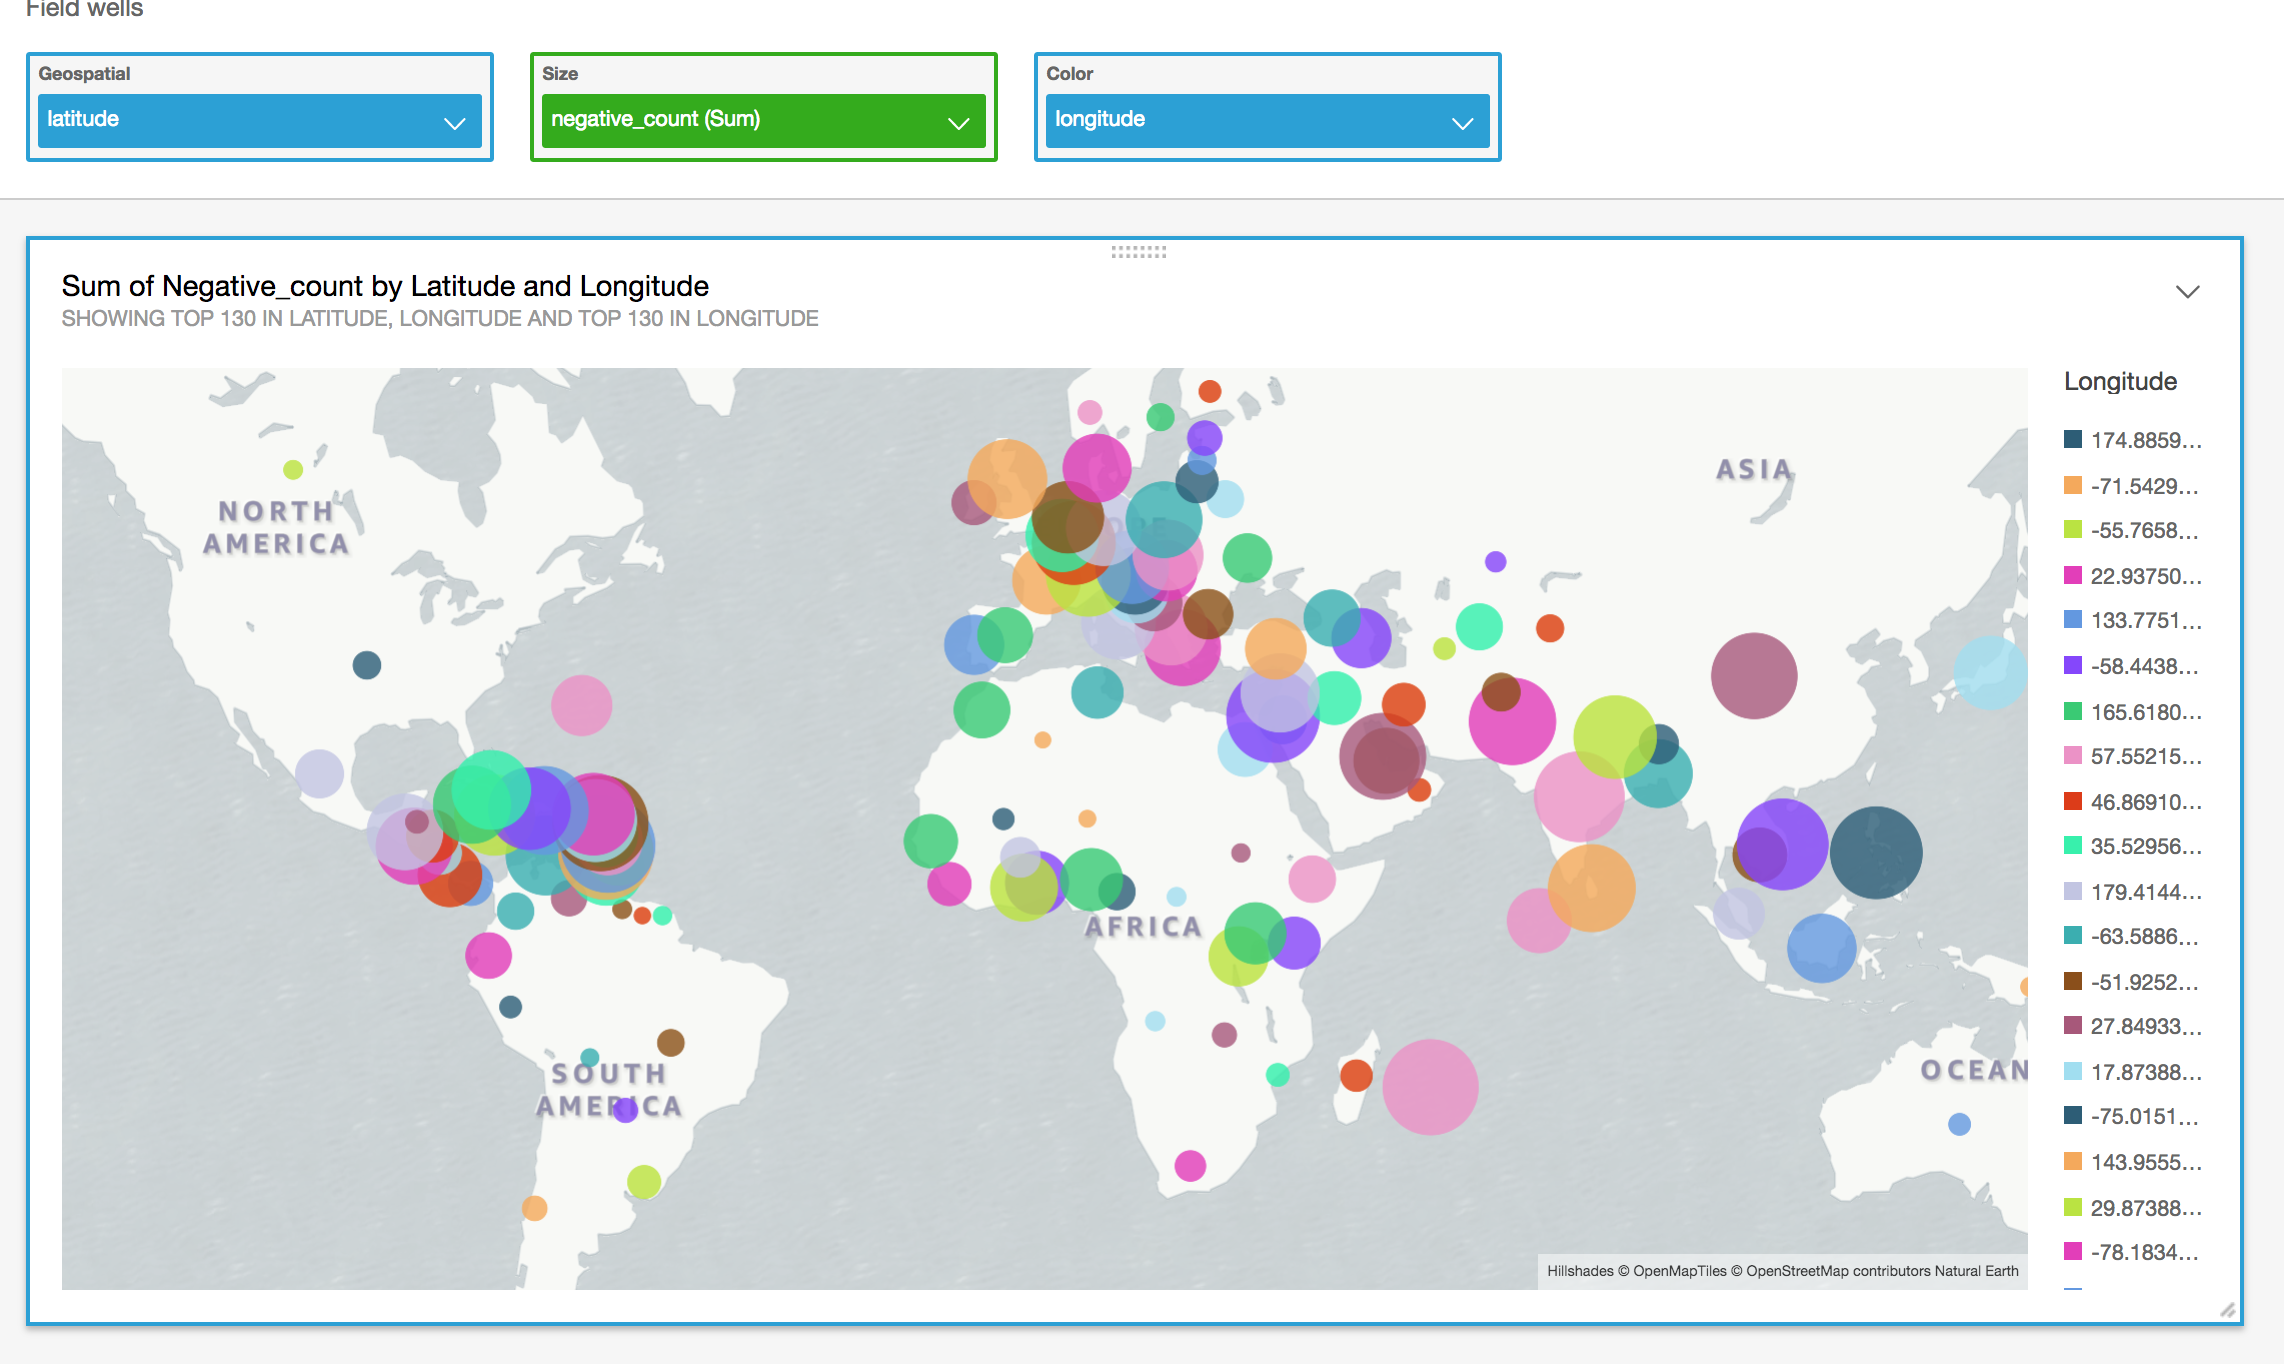
We are now going to open the QuickSight console and build a dashboard with the results from the Kinesis Analytics application. Ensure QuickSight is in the N. Virginia region.
From the QuickSight console we are going to create a new data set to visualize.
This will draw the dahsboard visualiation and show you where the most negative messages are coming from around the globe and help you plot your next move to escape from the zombies.
Some of the survivors come from a rich research background and want to run advanced analytics on the data lake.
In this lab, we are going to show how they can launch an EMR cluster integrated with the data lake and Glue Data Catalog.
Using a Zeppelin Notebook, the survivors will run ML algorithms using SparkML in order to predict areas of the highest spread of Zombies and where we want to move to with the greatest survivor rates.
Note: This may take approximately 1 min for both the crawlers to parse the data in CSV and Parquet format.
https://s3.amazonaws.com/serverless-analytics/zombie-datalake/deploy/SparkMLLab.json
Click on Choose a json here to select and import the SparkMLLab.json that you downloaded
Click on SparkMLLab notebook you just imported.
Note: There are 4 paragraphs in this Lab
- K-Means Model Creation using SparkML - This paragraph generate a K-Means model based on the Birthrate, Deathrate, Infantmortalityrate from WorldFactBook.csv data. The spark application use the AWS Glue Data Catalog table zombiedatalakeworldfactbook_csv to read the data from Amazon S3.
Running prediction based on the K-Means model using Spark Streaming - As simulated data generated by the Lambda functio lands into the Amazon S3 bucket the data is used to run prediction against the generated model using Spark Streaming. The result is store in a temp table "PredictionTable" to prediction queries to generate report. The prediction classifies the zombie data based on the model into 3 catagories: i. 0 - Safe Zone - with lower mortality rates ii. 1 - Warning Zone - with moderate birth and mortality rates iii. 2 - Danger Zone - with high mortality rates.
Terminate Spark Streaming Job - Helper paragraph to gracefully terminate the Spark streaming job.
To run the K-Means Model Creation using SparkML paragraph copy the value of the ZombieBucket from the CFN output from the Outputs tab of the CloudFormaiton teamplate.
Click the |> in the K-Means Model Creation using SparkML to generate the prediction model
Note: |> is hidden in the paragraph when the the Run Option is disabled.
Note: Run option is disable for all paragraphs except Prediction Report