Create professional EDA plots.
![]()
![]() Note: For a Tutorial on creating high-resolution PDF plots goto: Learn Guide - Making Check Plots
Note: For a Tutorial on creating high-resolution PDF plots goto: Learn Guide - Making Check Plots
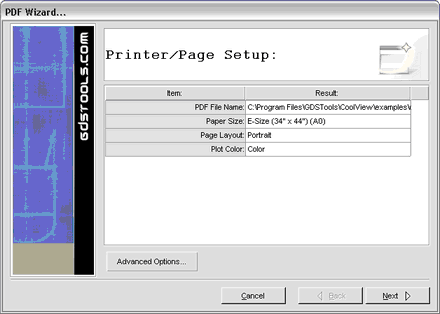
![]() PDF File Name:
PDF File Name:
Location of outputted PDF file
![]() Paper Size:
Paper Size:
Size of outputted document:
A-Size (8 1/2\" x 11\") (A4)
B-Size (11\" x 17\") (A3)
C-Size (17\" x 22\") (A2)
D-Size (22\" x 34\") (A1)
E-Size (34\" x 44\") (A0)
![]() Page Layout:
Page Layout:
Determine page orientation:
Portrait - Vertical page orientation
Landscape - Horizontal page orientation
![]() Plot Color:
Plot Color:
Choose whether plot color will be in Black & White or Color.
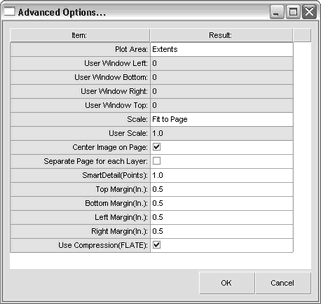
![]() Plot Area:
Plot Area:
Determine the workspace area to plot:
Extents - The smallest area that contains all geometries for the active design.
User Window - Select a specific area to plot, using the User window coordinates defined below.
![]() User Window Left:
User Window Left:
User selected area - left coordinate.
![]() User Window Bottom:
User Window Bottom:
User selected area - bottom coordinate.
![]() User Window Right:
User Window Right:
User selected area - right coordinate.
![]() User Window Top:
User Window Top:
User selected area - top coordinate.
![]() Scale:
Scale:
Determine the image scale to use on the plot:
Fit to Page - Automatically scale up to the maximum extents.
User - Enter in a specific user scale.
![]() User Scale:
User Scale:
Enter in a specific image scale to use on the plot.
![]() Center Image on Page:
Center Image on Page:
If unchecked, image will be placed using Left, and Bottom margins.
If checked, image is centered.
![]() Separate Page for Each Layer:
Separate Page for Each Layer:
If checked, a sperate page will be generated for each layer.
![]() SmartDetail(Points):
SmartDetail(Points):
This powerful feature optimizes the plotter output, by omitting any objects whose overall size is smaller than this value. In most cases, small details are not visible when they are printed onto paper; so it serves no purpose to include its' data in the plot. The result is a much smaller, easier to manage plot output. The units for Smart Detail are in points (1/72 Inch).
![]() Top Margin (In.):
Top Margin (In.):
Spacing on the top of the page.
![]() Bottom Margin (In.):
Bottom Margin (In.):
Spacing on the bottom of the page.
![]() Left Margin (In.):
Left Margin (In.):
Spacing on the left of the page.
![]() Right Margin (In.):
Right Margin (In.):
Spacing on the right of the page.
![]() Use Compression (FLATE):
Use Compression (FLATE):
Most PDF files that are created use compression to keep the file size small. However compressing a large or detailed PDF file can be very memory intensive, so in some cases it can be easier to work with an uncompressed PDF file. Although the uncompressed pdf file is extremely large (800mb for E-Size plots), Adobe's PDF Viewer actually reads these files faster because it is not required to also uncompress these file. These large uncompressed PDF files can also be externally compressed with zip, tar.gz, etc. for backing up, sharing via network or internet.
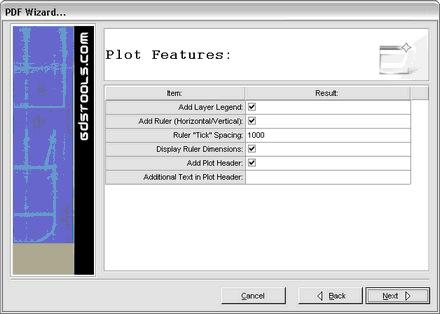
![]() Add Layer Legend:
Add Layer Legend:
Include a Layer Legend on the plot. A layer legend includes layer number, layer color & fill for each layer used on the plot.
![]() Add Ruler (Horizontal/Vertical):
Add Ruler (Horizontal/Vertical):
Include a horizontal & vertical ruler on the plot, located on the Left & Bottom sides. The ruler consists of a horizontal or vertical reference line with numbered ticks.
![]() Ruler "Tick" Spacing:
Ruler "Tick" Spacing:
Spacing used between ruler Ticks.
![]() Display Ruler Dimensions:
Display Ruler Dimensions:
Determine whether to number each tick on the ruler.
![]() Add Plot Header:
Add Plot Header:
Include standard information regarding the plot (Library/design, Scale, Plot Time, etc.)
![]() Additional Text in Plot Header:
Additional Text in Plot Header:
Include specific or custom plot information.
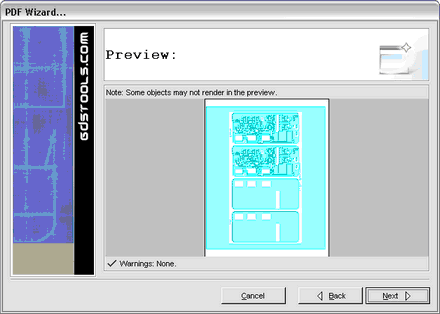
The Plot Preview gives the user the ability to preview the plot image & paper. If there are any potential problems, and warning will be placed under the preview image. If everything looks fine, selecting next will begin the creation of the PDF file.
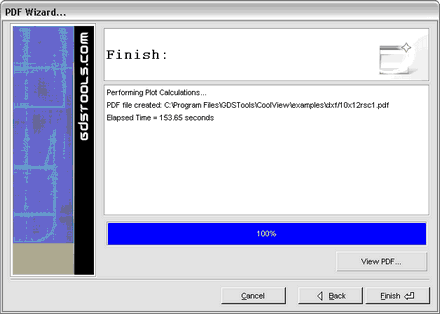
![]() View PDF (Windows Only):
View PDF (Windows Only):
Automatically views your created PDF file in Adobe Reader.
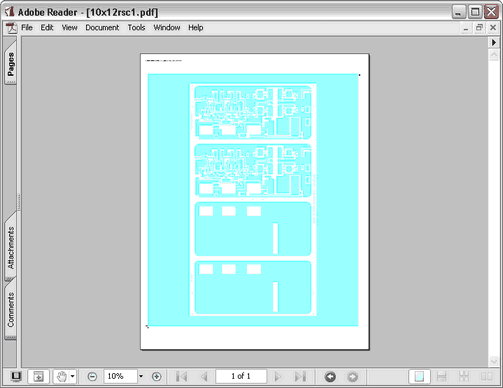
(Screen capture of 'E' size plot in Adobe Reader)
![]() Notes/Links:
Notes/Links:
![]() PDF creation is very memory intensive (due to image compression). Recommend at least 1-2 GB memory for creating large 'E' Size Plots.
PDF creation is very memory intensive (due to image compression). Recommend at least 1-2 GB memory for creating large 'E' Size Plots.