For many years Dobbs researchers worked within the bounds of a theory that all southern Dobbs were related and they could all trace their lineage back to a single Dobbs progenitor who was in some genealogies�identified as one�Fortune Dobbs who was born c. 1730� in Northern Ireland and who settled in the Carolinas in the 1750's. �He was also purported to be related to the Royal governor of North Carolina, Arthur Dobbs. In more recent times this theory has been�viewd at best as an over-simplification of the facts as they are documented in primary sources.
The participates listed in the NC to GA group have a number of things in common besides sharing a common surname. One thing they all have in common is�that none�of them can trace their Dobbs lineage back further than 4 or 5 generations. Which�is to say�that for all of them their documented Dobbs lines go back no further than the mid-18th century.
One thing that DNA testing cannot answer is who was the most recent common ancestor (MRCA) of this group of individuals, but what it can answer is when, in terms of statistics,�the MRCA lived.
Since none of the participates can trace their Dobbs ancestors back further than 6 generations then one the questions that we could hope to answer from this study is: What is the probability that one or more of the participates share a MRCA within 6 generations? Since the paper trial, as it is, does not got back further than 6 generations that seems to be the key question.�
| NC to GA Dobbs | |||||||||||||||||||||||||||||||||||||||
|---|---|---|---|---|---|---|---|---|---|---|---|---|---|---|---|---|---|---|---|---|---|---|---|---|---|---|---|---|---|---|---|---|---|---|---|---|---|---|---|
| 1 | 2 | 3 | 4 | 5 | 6 | 7 | 8 | 9 | 10 | 11 | 12 | 13 | 14 | 15 | 16 | 17 | 18 | 19 | 20 | 21 | 22 | 23 | 24 | 25 | 26 | 27 | 28 | 29 | 30 | 31 | 32 | 33 | 34 | 35 | 36 | 37 | Comment | ||
| Hap | 3 9 3 | 3 9 0 | 1 9 / 3 9 4 | 3 9 1 | 3 8 5 a | 3 8 5 b | 4 2 6 | 3 8 8 | 4 3 9 | 3 8 9 - 1 | 3 9 2 | 3 8 9 - 2 | 4 5 8 | 4 5 9 a | 4 5 9 b | 4 5 5 | 4 5 4 | 4 4 7 | 4 3 7 | 4 4 8 | 4 4 9 | 4 6 4 a | 4 6 4 b | 4 6 4 c | 4 6 4 d | 4 6 0 | Y G A T A H 4 | Y C A I I a | Y C A I I b | 4 5 6 | 6 0 7 | 5 7 6 | 5 7 0 | C D Y a | C D Y b | 4 4 2 | 4 3 8 | Comment | |
| (156633) | R1b1b2 | 13 | 23 | 14 | 11 | 11 | 14 | 12 | 12 | 11 | 13 | 13 | 29 | 20 | 9 | 10 | 11 | 11 | 25 | 15 | 19 | 31 | 14 | 15 | 17 | 18 | 10 | 12 | 19 | 23 | 16 | 15 | 17 | 18 | 38 | 38 | 12 | 12 | Kit #156633 claims descent from Lodowick Dobbs |
| (150597) | R1b1b2 | 13 | 23 | 14 | 11 | 11 | 14 | 12 | 12 | 11 | 13 | 13 | 29 | 20 | 9 | 10 | 11 | 11 | 25 | 15 | 20 | 31 | 14 | 15 | 17 | 18 | 10 | 12 | 19 | 23 | 16 | 15 | 17 | 18 | 38 | 38 | 12 | 12 | Kit #150597 claims descent from Fortunatus N. Dobbs |
| (N19106) | R1b1b2 | 13 | 23 | 14 | 11 | 11 | 14 | 12 | 12 | 11 | 13 | 13 | 29 | 20 | 9 | 10 | 11 | 11 | 25 | 15 | 19 | 31 | 14 | 15 | 17 | 18 | 10 | 12 | 19 | 23 | 16 | 15 | 16 | 18 | 38 | 38 | 12 | 12 | Kit #N19106 claims descent from Samuel W. Dobbs |
| (157251) | R1b1b2 | 13 | 23 | 14 | 11 | 11 | 14 | 12 | 12 | 11 | 13 | 14 | 29 | 20 | 9 | 10 | 11 | 11 | 25 | 15 | 19 | 30 | 14 | 15 | 17 | 18 | 10 | 12 | 19 | 23 | 16 | 15 | 17 | 18 | 38 | 38 | 12 | 12 | Kit #157251 claims descent from Balaam Dobbs |
| (154359) | R1b1b2 | 13 | 23 | 14 | 11 | 11 | 14 | 12 | 12 | 11 | 13 | 13 | 29 | 20 | 9 | 10 | 11 | 11 | 25 | 15 | 19 | 30 | 14 | 15 | 17 | 18 | 10 | 12 | 19 | 23 | 16 | 15 | 17 | 18 | 38 | 38 | 12 | 12 | Kit #154359 claims descent from James Dobbs |
| (159673) | R1b1b2 | 13 | 23 | 14 | 11 | 11 | 14 | 12 | 12 | 11 | 13 | 13 | 29 | 20 | 9 | 10 | 11 | 11 | 25 | 15 | 19 | 30 | 14 | 15 | 17 | 18 | 10 | 12 | 19 | 23 | 17 | 15 | 17 | 18 | 38 | 39 | 12 | 12 | Kit #159673 claims descent from Martin Dobbs |
| (153038) | R1b1b2 | 13 | 23 | 14 | 11 | 11 | 14 | 12 | 12 | 11 | 13 | 13 | 29 | 20 | 9 | 10 | 11 | 11 | 25 | 15 | 19 | 30 | 14 | 15 | 17 | 18 | 10 | 12 | 19 | 23 | 16 | 15 | 17 | 19 | 38 | 38 | 12 | 12 | Kit #153038 claims descent from Mormon Dobbs |
Time To Most Recent Common Ancestor
Using the Y-DNA Comparison Utility and the NC-to-GA test results data from FTDNA we can plot the Time to the Most Recent Common Ancestor (TMRCA) in number of generations showing the 50% probability that the distance to the MRCA was no longer than a specified number of generations. The chart below shows the time in generations to the most recent common ancestor between each of the members of the NC to GA group.
| � | � | A | B | C | D | E | F | G |
| � |
ID |
1 |
1 |
N |
1 |
1 |
1 |
1 |
| A |
156633 |
** |
4 |
4 |
7 |
4 |
10 |
7 |
| �B |
150597 |
4 |
** |
7 |
10 |
7 |
12 |
10 |
| �C |
N19106 |
4 |
7 |
** |
10 |
7 |
12 |
10 |
| �D |
157251 |
7 |
10 |
10 |
** |
4 |
10 |
7 |
| �E |
154359 |
4 |
7 |
7 |
4 |
** |
7 |
4 |
| �F |
159673 |
10 |
12 |
12 |
10 |
7 |
** |
10 |
| �G |
153038 |
7 |
10 |
10 |
7 |
4 |
10 |
** |
What this chart says, for example, is that if we compare kit #157251(row D) with kit #154359 (col E) we see that based on the testing results that there is a 50% probability that the TMRCA is no longer than 4 generations. If we compare kit #159673 (row F) with kit# 153038 (col G) we see that�there is a 50% probability that the TMRCA is no longer 10 generations.
Drawing Conclusions
What conclusions, if any, can be drawn from testing results? There are probably several different opinions in this regard. Some may not want to draw any conclusions now, considering it to be top early and seeing the data to be insufficient at this time. Others may see the results as validating or reflecting positively conclusions they have already arrived at. For some the test results may be seen as providing answers to some questions, but they may also see new questions coming out of the results. While I do not see myself as being an expert in this field and therefore not certain if any definite conclusions can be made at this time, I do find it helpful - at least for my own edification - to make some observations.
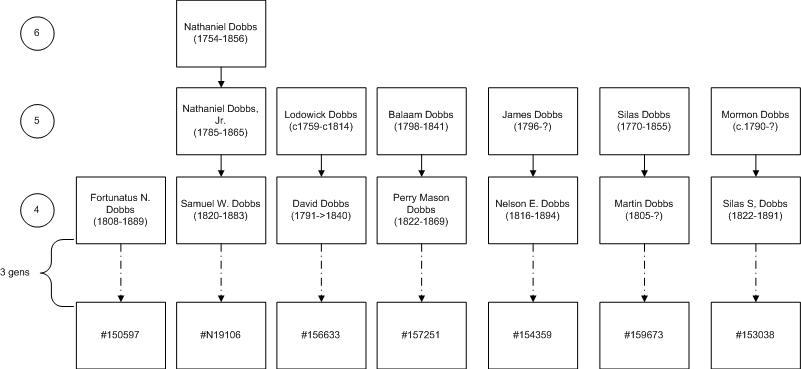
What We Know
The chart below shows what we know, based on the documentation as it stands:
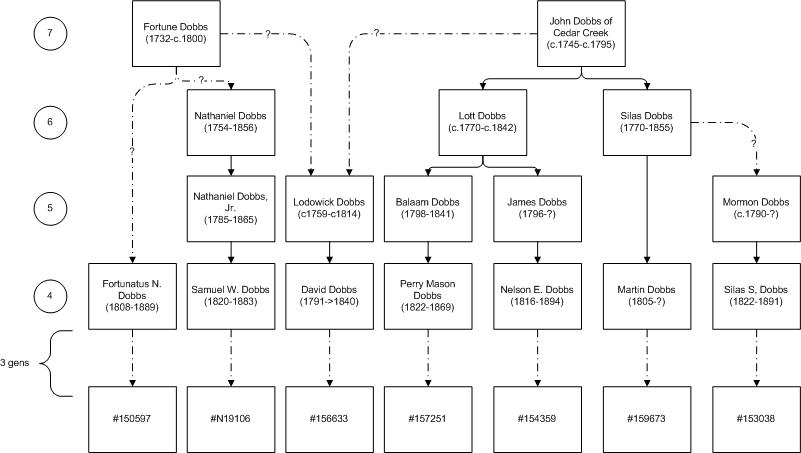
What We Think We Know
The next chart expands on what we know applying current working theories that have been developed by various Dobbs researchers. Shown below, for example, is that the relationship between Lodowick Dobbs & John Dobbs of Cedar Creek is questioned and some believe Lodowick to be a son of Fortune Dobbs. There is also a theory that Nathaniel Dobbs, Fortunatus N. Dobbs, and Fortune Dobbs are all related in some way.
What the Test Results Suggest
Given what we know and what we think we know, how does this compare with what the test results suggest? Surprisely it does seem to support some working theories while at the same time it does place into doubt some of what we think we know:
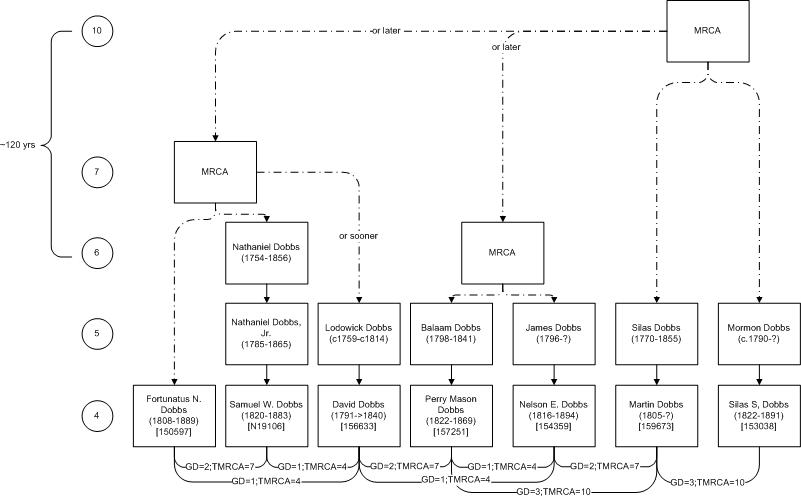
If we compare the two members of the NC to GA group who claim descent from Lott Dobbs (c 1770 - c 1842) - Kits #157251 and #154359. The results indicate that there is a genetic distance of 1 between them - 36/37 match. With an average mutation rate of .0043 this would indicate that there is 56.1% probability that these two share a Most Recent Common Ancestor (MRCA) within 6 generations and 50% probabilty that the MRCA is within 4 generations. The results here seem to validate what is known from the paper-trail.
If we compare the two members of the NC to GA group above who are considered possible descendents from Fortune Dobbs - Kits #N19106 and #150597. The results indicate that there is a genetic distance of 2 between them - 35/37 match. With an average mutation rate of .0043 this would indicate that there is 50% probability that these two share a Most Recent Common Ancestor (MRCA) within 7 generations. This would seem to lead some support to the theory of Fortune Dobbs being a progeniture for these two men. However, more research is required in order to determine who the actual MRCA is.
If we compare the two members of the NC to GA group who are both thought to descend from Silas Dobbs (c 1770 - c 1842) - Kits #159673 and #153038. The results indicate that there is a genetic distance of 3 between them - 34/37 match. With an average mutation rate of .0043 this would indicate that there is only a 11.4 % probability that these two share a Most Recent Common Ancestor (MRCA) within 6 generations. While the results do indicate that these men are related, the results indicate that the number of generations to the MRCA is more likely (50-50) to be within 10 generations and not as anticipated to be within 5 generations. This seems to support the theory that Mormon Dobbs was NOT a descendent of Silas Dobbs.
| Dobbs DNA Table of Contents | Project Details | More Information |