![]() AWS NYC Summit 2018
AWS NYC Summit 2018
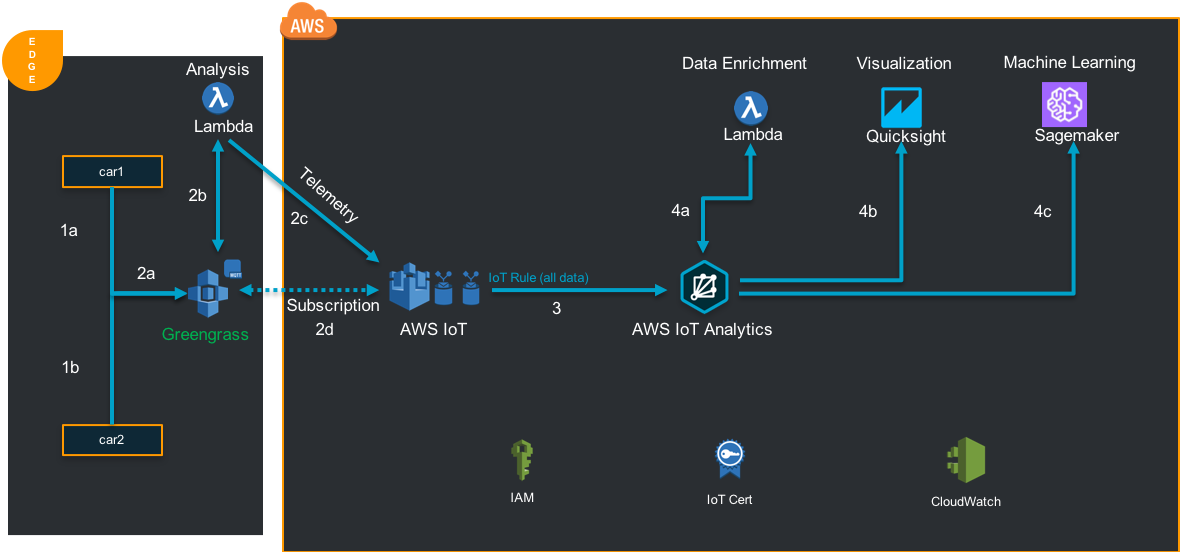
This Workshop will provide an understanding of AWS Greengrass, AWS IOT Core and AWS IOT Analytics Services. During this workshop you will learn how edge devices can publish data to Greengrass & AWS IOT. You will configure Greengrass enabled devices on Ec2 instances, and setup communication via Greengrass. To demonstrate the data flow from a device, "sensor data" will be generated by a simulator script.The data will then be collected by IOT Core and will be transformed / analysed using IOT Analytics. Thereafter you can try an OPTIONAL section , where you may visualize various trip metrics from Quicksight. You may also try to perform Anomaly detection on telemetry data using a jupyer notebook deployed in Sagemaker instance.
To conduct the bootcamp you will need the following tools/setup/knowledge:
[Top]
You will build this architecture:
[Top]
By choosing one of the links below you will be automatically redirected to the CloudFormation section of the AWS Console where your stack will be launched.
After you have been redirected to the AWS CloudFormation console take the following steps to launch you stack:
1. Parameters
2. Select SSHKeyName
3. Capabilities -> check "I acknowledge that AWS CloudFormation might create IAM resources." at the bottom of the page
4. Create
5. Wait until the complete stack is created
In the Outputs section of your CloudFormation stack you will find the ssh login string for your EC2 instance.
[Top]
You will provision both the cars through the scripts installed on the Ec2 instance through cloudformation.
SSH into the Ec2 instance
INFORMATION ONLY - You should see the following directory contents in /home/ec2-user directory:
START THE WORKSHOP FROM HERE - Create the Connected Cars :
1. Run the script  ./provision-iot-things.sh
    a. Enter name of the first car > car1
    b. Enter name of the second car > car2
    c. Enter device type > connectedcar
2. The script will create
    a. IOT things (a.k.a connectedcars)
    b. Certificates (per device)
    c. Policies (and attach to certificates )
3. Please check the keys and X509 certificates exists as below -
    a. car1 folder - car1.public.key, car1.private.key, car1.certificate.pem
    b. car2 folder -  car2.public.key, car2.private.key, car2.certificate.pem
Log into the the IOT Core Console
1. Check if the things (car2 and car1) are showing up in the console
2. Click on car2 > Security -> Certificate -> Policies -> edworkshop-policy
a. Check the permissions exists for IOT and Greengrass as below :
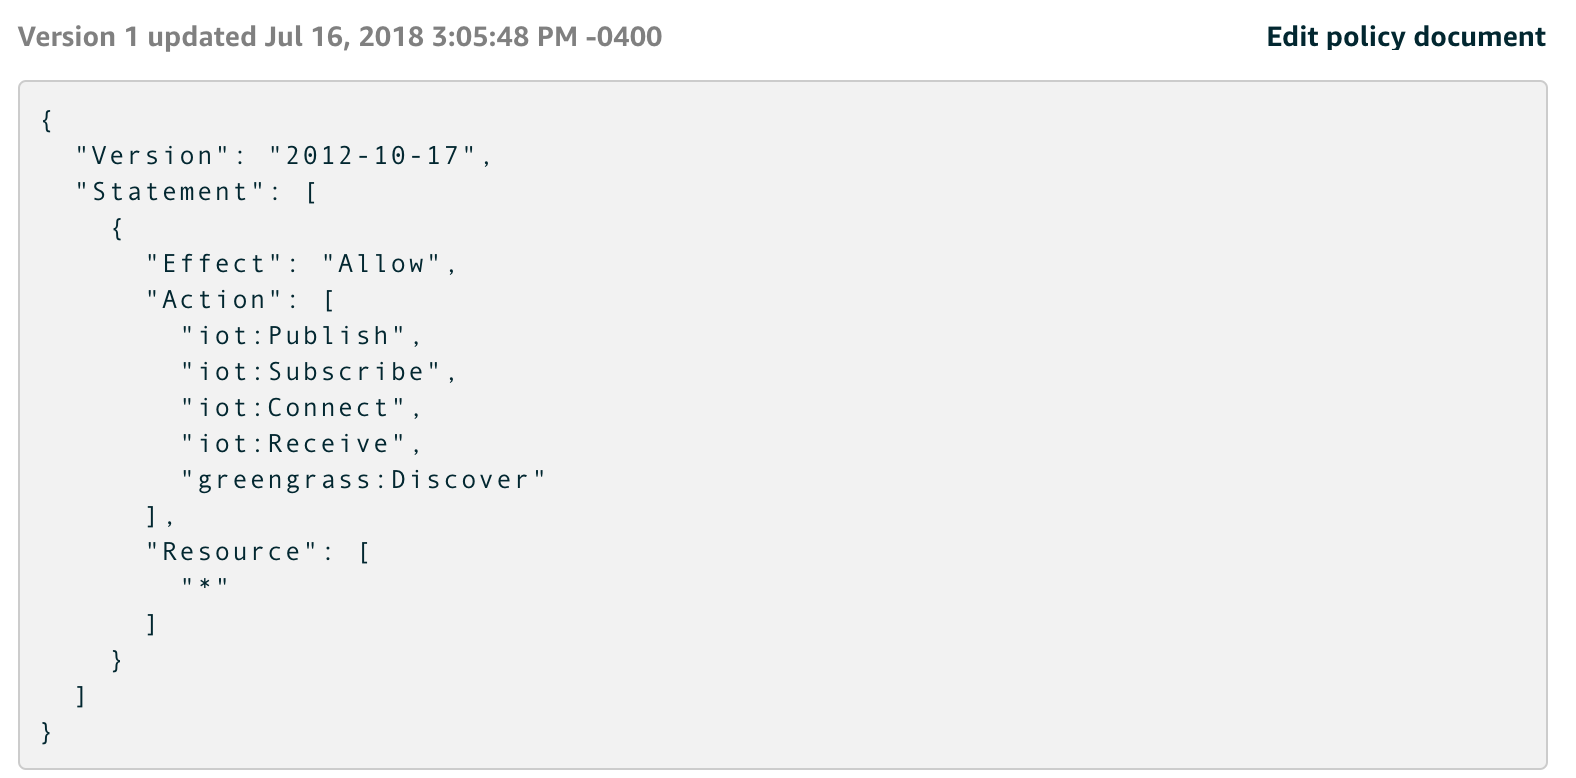
Repeat the same steps for car1
For sending sensor data from a random function we provide the following scripts:
On your device:
The script "start-iot.sh" in the directory "car1" and "car2" to be executed for sending data to AWS IOT:
1. cd car1
2. sudo ./start-iot.sh

Repeat the above steps for car2 in a different terminal
Subscribe to the MQTT client built in to the AWS IoT console to see the messages which will be sent later on.
Go to the AWS IoT console
1. Test
2. Subscription topic: workshop/staging -> Subscribe to topic

Watch at the MQTT client in the AWS IoT console if the messages are coming for car1 and car2.
If yes , Stop the scripts (CTRL_C)[Top]
How vehicles will connect to your Greengrass core and send data to the cloud.
In this section, we will create the Greengrass Core and make the IOT things (car1 and car2) greengrass enabled.
On the Ec2 instance: cd /home/ec2-user
Execute the below commands :
1. gg_group_setup create-core --thing-name ggsummitcore --config-file ./cfg.json --region paste_your_region_name
2. gg_group_setup create --group-type mock --config-file cfg.json --group-name ggsummit-group --region paste_your_region_name
3. sudo ./update-config.sh (choose the region you are working on)

Verify in the AWS IoT console -
1. Greengrass -> Group -> "ggsummit-group" has been created
2. Greengrass -> Group -> "ggsummit-group" -> Core -> "ggsummitcore" has been created
By default logging is not enabled for the Greengrass Core. Logging should be enabled to get insights what happens on the Core and also for troubleshooting purposes.
Go to the Greengrass console
1. Groups
2. ggsummit-group
3. Settings
4. Scroll down
    Local logs configuration -> Edit
5. Add another log type
6. Check both "User Lambdas" and "Greengrass system"
    Update
7. What level of logs should be sent? -> Select Debug logs
7. Save
cd /greengrass/ggc/core
sudo ./greengrassd startIf Greengrass starts successfully, you will get a message "Greengrass successfully started with PID: XXXXX"
If any issues starting the Greengrass daemon , please refer to Troubleshooting
[Top]
The Greengrass Group consists currently only of a Core. In this step you will add vehicles to the Group. You will use the vehicles "car1" and "car2" which you used before. But these device will later be configured to connect to your Core instead of AWS IoT.
Go to the Greengrass console
1. Groups
2. ggsummit-group
3. Devices
4. Add your first Device
5. Select an IoT Thing
6. Select car1 -> Finish
7. Add car2 in the same way to your Greengrass Group[Top]
In this section we will add the lambda function, to the greengrass subscriptions and deploy.
Go to the Greengrass console
1. Groups
2. ggsummit-group -> Lambdas -> Add Lambda
3. Use existing Lambda ->  edgelambda -> choose version 1 of "edgelambda" -> Finish
4. Finish[Top]
The two vehicles car1 and car2 which you just added to the Greengrass Group should communicate as a publisher to the lambda function at the edge.
To route messages from the vehicles to lambda to cloud, a so called subscription must be defined.
A subscription is a routing rule which consists of a source, a target an a topic filter. A subscription defines which source may communicate to which target on which topic.
In this exercise messages will be sent from the vehicles to the cloud. To route the messages accordingly from a device to the cloud another subscription has to be created.
Create a subscription in your Greengrass Group from console with:
Go to IOT -> Greengrass -> Groups -> ggsummit-group -> Subscriptions -> Add Subscription
Source: Device -> car1
Target: Lambda (choose edgelambda function)
Optional topic filter: workshop/staging
Finish
Similarly create the below 2 subscriptions :
Source: Device -> car2
Target: Lambda (choose edgelambda function)
Optional topic filter: workshop/staging
Finish
Source: Lambda (choose edgelambda function)
Target: Services -> IOT Cloud
Optional topic filter: workshop/telemetry
FinishWe have now created vehicles and subscriptions in the Greengrass Group and are ready for the first deployment. But before deploying for the first time let's enable logging for Greengrass.
[Top]
Now the Greengrass subscriptions / lambda needs to be deployed to the Greengrass Core.
On the Ec2 instance:
sudo su
cd /greengrass/ggc/var/log/system
tail -f localwatch/localwatch.log *.log
In the AWS Greengrass Console
1. Groups
2. ggsummit-group
3. Actions -> Deploy
4. Choose Automatic detection
After some moments you should see activity in the logs on the device and the deployment status at the console.
Go to the AWS IoT console
Go to AWS IoT -> Test, subscribe to the topic workshop/telemetryOpen 2 sessions of your device (Ec2) to run the below scripts in parallel.
cd car1 sudo ./start-gg.shcd car2 sudo ./start-gg.sh
Look for incoming messages in the AWS IoT MQTT client, keep this scripts running.
[Top]
In this section we will create the IOT Analytics components, analyze data and define different pipeline activities.
On your device, open a new session of Ec2 to execute the below :
1. cd /home/ec2-user/iotanalytics
2. Create Datastore -
    a. aws iotanalytics create-datastore --datastore-name mydatastore
    b. aws iotanalytics describe-datastore --datastore-name mydatastore
3. Create Channel -
    a. aws iotanalytics create-channel --channel-name mychannel
    b. aws iotanalytics describe-channel --channel-name mychannel
4. Create Pipeline -
    a. aws iotanalytics create-pipeline --cli-input-json file://mypipeline.json
    b. aws iotanalytics describe-pipeline --pipeline-name mypipeline
5. Create Topic Rule
    a. aws iot create-topic-rule --rule-name iotAnalyticsRule --topic-rule-payload file://rule.json

Now we have created the IOT Analytics Pipeline and ready to analyze the data. [Top]
On your device:
Continue on the same directory - /home/ec2-user/iotanalytics

1. Create Dataset
    a. aws iotanalytics create-dataset --cli-input-json file://mydataset.json
2. Create Dataset Content (Execute the Query)
    a. aws iotanalytics create-dataset-content --dataset-name mydataset
3. Get Results from the Query
    a. aws iotanalytics get-dataset-content --dataset-name mydataset
    NOTE :
    It might take few mins for the dataset to update and return the URI. So rerun the command until you get the URI.
    Then copy the https link  from URI -> run in any browser -> download the CSV -> check the data.
Go to AWS Console: IOT Analytics
Experience the Console now -

1. Go to AWS IOT Aalytics -> Prepare
    a. Go to channels -> Check mychannel exists
    b. Go to Pipelines -> Check mypipeline exists
    c. Go to Data Stores -> Check mydatastore exists
2. Go to AWS IOT Aalytics -> Analyze ->
    a. Datasets -> mydataset -> Actions -> Run Query now
    b. Wait for few mins for the results to appear in the Result preview section of the screen.
[Top]
In this section we will enrich the AWS IOT analytics messages by adding weather and Geo information.
On your device: Ec2 instance
1. cd /home/ec2-user/iotanalytics

2. Update IOT Analytics pipeline to enrich weather / geo data for the vehicles using Lambda :
    a. aws iotanalytics update-pipeline --pipeline-name "mypipeline" --cli-input-json file://mypipelineAddLambda.json
3. Create Dataset Content (Execute the Query).
    a. aws iotanalytics create-dataset-content --dataset-name mydataset
    NOTE :
    It might take 2-4 mins for the dataset to refresh and return the updated data.
    So rerunning the command without waiting will get you stale data.
4. Get Results from the Query (Ensure start-gg scripts are running for car1 and car2 on device)
    a. aws iotanalytics get-dataset-content --dataset-name mydataset
    Copy the https link  from URI -> run in any browser -> download the CSV -> check the data.
5. The dataset should return additional fields (Weather and Zipcode)

You can also run the query from AWS Console (mydataset-> Actions -> Run Query now) to avoid cli steps as above.
1. Update IOT Analytics pipeline to enrich device (car) metadata using built-in activity :
    a. aws iotanalytics update-pipeline --pipeline-name "mypipeline" --cli-input-json file://mypipelineRegistryEnrich.json
2. Create Dataset Content (Execute the Query).
    a. aws iotanalytics create-dataset-content --dataset-name mydataset
    NOTE :
    It might take 2-4 mins for the dataset to refresh and return the updated data.
    So rerunning the command without waiting will get you stale data.
3. Get Results from the Query (Ensure start-gg scripts are running for car1 and car2 on device)
    a. aws iotanalytics get-dataset-content --dataset-name mydataset
    Copy the https link  from URI -> run in any browser -> download the CSV -> check the data.
4. The dataset should return additional fields (metadata)

You can also run the query from AWS Console (mydataset-> Actions -> Run Query now) to avoid cli steps as above.
1. Update IOT Analytics pipeline to enrich device (car) shadow using built-in activity :
    a. aws iotanalytics update-pipeline --pipeline-name "mypipeline" --cli-input-json file://mypipelineShadowEnrich.json
2. Create Dataset Content (Execute the Query).
    a. aws iotanalytics create-dataset-content --dataset-name mydataset
    NOTE :
    It might take 2-4 mins for the dataset to refresh and return the updated data.
    So rerunning the command without waiting will get you stale data.
3. Get Results from the Query (Ensure start-gg scripts are running for car1 and car2 on device)
    a. aws iotanalytics get-dataset-content --dataset-name mydataset
    Copy the https link  from URI -> run in any browser -> download the CSV -> check the data.
4. The dataset should return additional fields (shadow)

You can also run the query from AWS Console (mydataset-> Actions -> Run Query now) to avoid cli steps as above.
If you donot intend to complete the Bonus section below, please go to Clean Up
[Top]
 1. Go to AWS IOT Aalytics -> Analyze ->
    a. Datasets -> mydataset -> SQL Query -> Edit
    b. Paste the below queries in the SQL editor and run:
        A. Check the # of trips by vehicle
        1. select device, trip_id, count(*) as count from mydatastore group by device, trip_id
        2. Actions -> Run Query now
        B. Check if the mean speed of cars exceeds limit in a specific location and weather :
        3. SELECT device, weather, engine_speed_mean, zipcode FROM mydatastore where engine_speed_mean > 60
        4. Actions -> Run Query now
    NOTE :
    It might take few mins for the query to run and update the console with results.
    Feel free to modify the queries and play with other attributes to get more insights.

  If you intend to complete the section below, Please make this below change.
  Else skip this step and go to Clean Up
      2. Go to AWS IOT Aalytics -> Analyze ->
      a. Datasets -> mydataset -> SQL Query -> Edit
      b. Paste the below query in the SQL editor and save:
          1. select * from mydatastore
      c. Click Actions -> Run Query Now
In this section we will visualize the time series data captured from connected cars.
1. Go to the AWS Quicksight console. (Enroll for standard edition, if you have not used it before)
2. Select New Analysis -> New data set -> Choose AWS IOT Analytics
3. Enter Data source name -> mydataset_analytics
4. Select an AWS IOT Analytics dataset to import - mydataset
5. Create data source -> Visualize
5. Determine the car safety score
    a. Choose device for Y axis , High_breaking_event for X Axis (choose the Count function)
6. Check the fuel usage
    a. Choose device for Y axis , fuel_level for X Axis (choose the Average function)

Feel free to play with different fields for car related information.
[Top]
In this section we will configure the sagemaker instance to perform anomaly detection.
1. Go to the AWS IOT Analytics console.
2. Select Analyze -> Notebooks -> Create
3. Choose Detecting Contextual Anomalies template
4. Name -> EdgeworkshopNotebook
5. Select data source -> mydataset
6. Select notebook instance -> BasicNotebookInstance* (check the name from Cloudformation outputs tab )
7. Create Notebook
8. Select BasicNotebookInstance* -> IoTAnalytics -> EdgeworkshopNotebook.ipynb -> Open in Jupyter

This will open the Jupyter notebook in sagemaker.
In this section we will use the jupyter notebook to perform anomaly detection.
1. Run through the steps prioir to Step 1 - Loading Data
2. Make the below changes to this section : In[2]
    a. time_col = 'datetime'
    b. value_col = 'oil_temp_mean'
3. Make the below changes to this section : In[3]
    a. Delete EVERYTHING under "# use backup dataset if dataset not found" and paste the below :
    b. except:pass
4. Step through the remaining steps to visualize the anomaly in the graph.
[Top]
Please cleanup the resources so that you dont incurr additional charges after workshop.
Go to the AWS console
1. Go to the IOT console -> Greengrass -> Groups -> Choose the Group *GGG*
    *Actions -> Reset deployments -> Force Reset
    *Actions -> Delete group
SSH to the Ec2 instance
1. Execute clean-iot-things.sh from home directory
    a. This script deletes all devices , certificates , policies created part of the workshop
2. Execute clean-iot-analytics.sh from home directory
    a. This script deletes all the IOT Analytics components
3. Finally, Go to the cloudformation console and delete the stack created part of the workshop
[Top]
Check if the Greengrass daemon is running on Ec2 :
1. Check if the greengrass process is running
    a. ps aux | grep greengrass | grep -v grep
2. Become Root to access the below directories : sudo su
3. Check the greengrass logs :
    a. tail -f /greengrass/ggc/var/log/crash.log
    b. cd /greengrass/ggc/var/log/system/
    c. tail -f runtime.log
Restart Greengrass core if errors and check the logs :
1. Stop greengrass Core :
    cd /greengrass/ggc/core
    sudo ./greengrassd stop
    tail -f /greengrass/ggc/var/log/system/runtime.log

2. Restart the greengrass core  :
    cd /greengrass/ggc/core
    sudo ./greengrassd stop
    tail -f /greengrass/ggc/var/log/system/runtime.log

Check if greengrass deployment shows successful and connected to cloud in the logs. If not ask a moderator for help.

Follow the steps after Greengrass Deployment - Add vehicles to the Greengrass Group
[Top]
Troubleshooting for IOT Core issues. Go to the AWS IoT Core console
1. Get started (only if no resources are provisioned)
  2. Settings
  3. CloudWatch Logs (if DISABLED) -> Edit
  4. Change "Disable Logging" to "Debug (most verbose)"
  5. Set role -> Select the role "IOTLoggingRole"
  6. Update
  7. Click upgrade to JSON logging if prompted
The log files from AWS IoT are send to Amazon CloudWatch. The AWS console can be used to look at these logs.
[Top]
Troubleshooting for IOT Analytics issues. Go to the AWS IoT Analytics console
1. Get started (only if no resources are provisioned)
  2. Settings
  3. Logs (if DISABLED) -> Edit
  4. Change "Disable Logging" to "Error"
  5. Set role -> Create new -> iotanalyticsloggingrole -> Create Role
  6. Update
The log files from AWS IoT Analytics will be send to Amazon CloudWatch. The AWS console can be used to look at these logs.
[Top]