HMH Ed™ offers a set of reporting dashboards for district and school administrators. The Administrator Assessment report offers district and school assessment coordinators, instructional leaders, and many other roles across our districts, the tools to view and analyze student results from a variety of assessments included with many of the Core, Supplemental, and Intervention curriculum programs from HMH.
Teachers have their own Assessment Overview and Assessment Details Reports that are based on the program assessments they assign to their classes. Teachers use these reports for a variety of data-driven instructional planning, item and standards analysis, gradebook and report card workflows.
The Administrator Assessment report provides district administrators a "rolled up" version of the teacher Class Reports across classes, teachers, and schools for a broader analysis. For most US K–12 school districts, the Assessment Report shows each school’s averages, and for larger districts, the first view is their school groups (regions and community school districts, for example). School groups drill into schools, schools drill into leader teachers, and leader teachers drill down into classes.
Administrators can view completed test counts, unique student counts, school groups, and schools for an overall participation gauge as well as evaluate item and distractor data point like standard alignment, average score, time spent, and distractor analysis for select item types.
1. In the banner, click the Reports tab, and on the Reports page, select Assessment Report card.
The Assessment Report page appears.
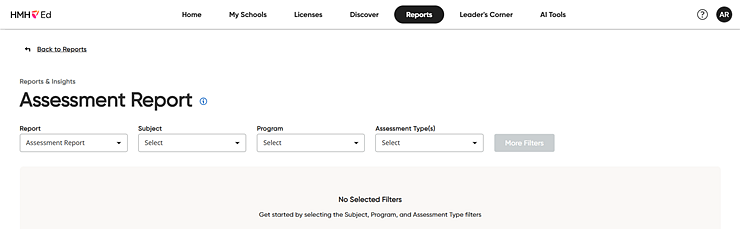
2. Use the lists above the report to filter selections and change the data displayed in the report, as follows:

– In the Subject list, select the subject you want to view.
– In the Program list, select the program. Most programs name contain the corresponding grade level of the program.
– In the Assessment Type(s) list, select a grade level.
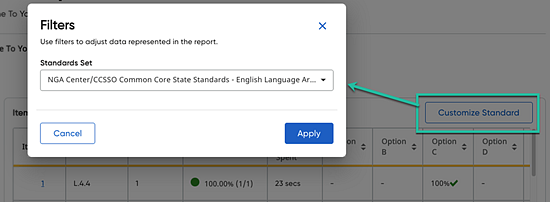
– To change the school group or school for the report (as an alternative to drilling into the Assessment Details Report table to find specific school groups, school, or lead teachers) or to specify the standards Set or Period, do the following:
a. Click the More Filters button. A Filters dialog box appears with added filter options (if available), including School Group, School, Standards Set, and Period lists.

Note: The time-period is limited to the current school year only for this initial release, meaning that because this report releases in June, only assessments taken in the 2024/2025 school year will be included. This is from ~June 30th 2024 to today and continuing to ~June 30th 2025.
b. Select the options from the lists provided, and then click Apply. The report updates to reflect your selected filters.
Note: The Applied filters section lists the selected filters for the report. You can remove an applied filter by clicking the X for that filter, and you can remove all the filters and return to the defaults by clicking the Reset all filters option.
Once the selections are made, the Assessment Overview Report loads.
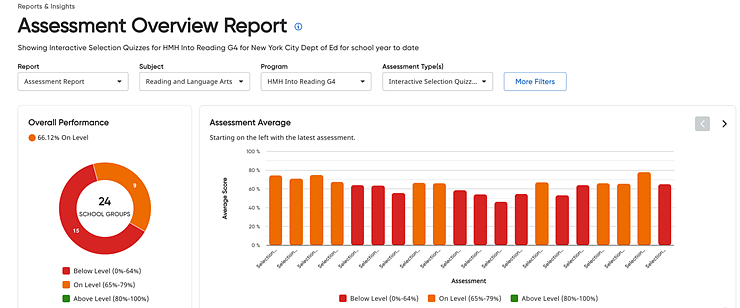
3. Note the following details about the Administrator Assessment Overview Report.
This report...
– Combines thousands and in many cases hundreds of thousands of student-completed item and test records and may take a full minute to load the summary information.
– Displays all the assessments completed in the current school year for the program and assessment type selected for the “organization” connected to the role of the user interacting with the report. For example, if you have a district administrator role, the report shows all schools (or all school groups if your district has school groups); if you have a school administrator role, the report shows all the completed assessments for your school only.
– Organizes data into three components—the Overall Performance (donut chart), Assessment Average (bar chart), and Assessment Results (table).
The organization may be a district, school groups, a school, lead teachers, or classes.

The three sections of the Assessment Overview Report are detailed as follows:
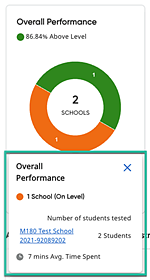
Overall Performance (donut chart)
The average overall performance for each assessment is then averaged across all other assessments (for the type) and the associated performance level is applied. The three performance levels are: – Above Level: 80% to 100% – On Level: 65% to 79.99% – Below Level 0% to 64.99% You can click the donut component to view more details about the respective performance level. A dialog box opens with the number of students tested by their organization and average time spent across all assessments in that type for the current school year. Click the listed organization link (for example: school) in the dialog box to open the Administrator Assessment Overview Report for the selected organization. |
Admin Assessment Overview Bar Chart
The bar chart displays the three performance level colors (green, orange, red). Pagination arrows appear in the upper right of the bar chart for large data sets. Clicking the bar chart opens a dialog box with details, such as: – Overall performance color circle and percent score – Organization (for example: schools, class) grouping by the three-performance levels – Average Time Spent – Number of Test Taken – Number of Unique Students – Number of School Groups – Number of Schools – Number of Teachers – Number of Classes
You can click the Go to Detailed View button to view the Administrator Assessment Detail Report.
|
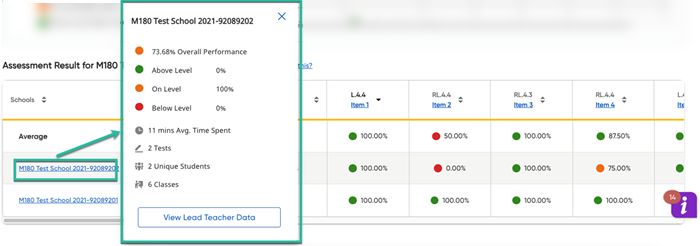
Admin Assessment Overview Table The table shows the assessment result for a given organization, program and their overall performance, and per test performance levels. The first column of the table lists the organization. You can click an organization link and navigate to schools, teachers, or classes Administrator Assessment Overview Report.
Clicking the table header assessment name allows you to navigate to the Administrator Assessment Details Report as shown in the example below.
|
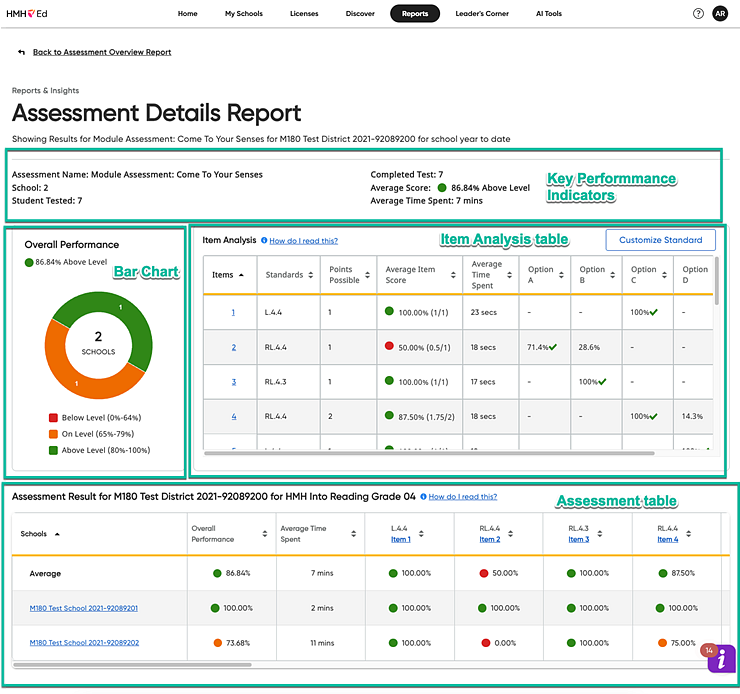
4. From the Assessment Overview Report, drill into your Administrator Assessment Details Report and note the following about this report:
The Assessment Details Report provides you with that next level of analysis assessment-oriented leaders need. While the Summary Report provides a snapshot of overall performance to look across assessments and gauge overall participation and performance, the Assessment Details Report takes that next step by focusing on the items in a single test. The same levels of aggregation and disaggregation remain available as in the Summary Report. The default view is the top level district performance, school group by school group and or school by school. Drilling further unpacks the results by teacher and class.
The data is a combination of overall assessment details AND item details.
This report includes the following four components:
– Key Performance Indicators
– Overall Performance Bar Chart
– Item Analysis table
– Assessment Result table
The four sections of the Assessment Details Report are described as follows:
Key Performance Indicators
This section provides you with a quick summary of pertinent usage and performance details for your organization.
|
Admin Assessment Details Overall Performance (donut chart)
The performance level-colored circles (green, orange, red) breakdown percent within your organization across these three broad categories. When you click in the chart, a dialog box opens with the number of students tested by your organization and average time spent. You can click the listed organization (example: school) link in the dialog box to further view Administrator Assessment Details report for your respective organization. |
Admin Assessment Details Item Analysis Table The Item Analysis section lists each item on the test with a set of information for each item to help meet a variety of data-driven workflows.
– Item Sequence number – Standard alignment coding number – Maximum points possible – Average item score – Average time spent per item – Distractor
Analysis columns, which are labeled Options A to Option F.
Note: Item Analysis table indicates multiple-part questions with an arrow beside the item number. Clicking the arrow expands to show the multi-part question students’ score and option choice. Clicking the arrow again collapses the item multi-part display.
Note that filters can be applied on the Administrator Assessment Overview/Detail Reports.
Applied Filters are displayed on the reports as you navigate through the reports. You can remove filters by clicking the X button or Clear All text.
|
Admin Assessment Details Table The table shows the assessment result details for an organization, the overall performance, and per item performance levels. It is also the primary mechanism to drill down into the schools, lead teachers, and classes. The first column of the table lists the organization (School groups, Schools, Lead Teachers, and Class). You can click the organization link to narrow down details to school, teacher, or classes assessment report. The table header items show the points possible; primary and secondary standards display as applicable. Clicking the Item link loads the item viewer, if applicable.
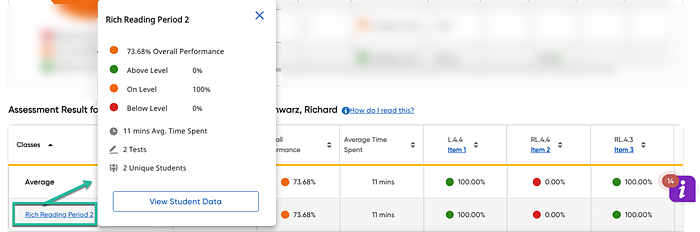
As shown below you can navigate through the organization to the class. Clicking the View Student Data button opens the Teacher Assessment Report for the respective class.
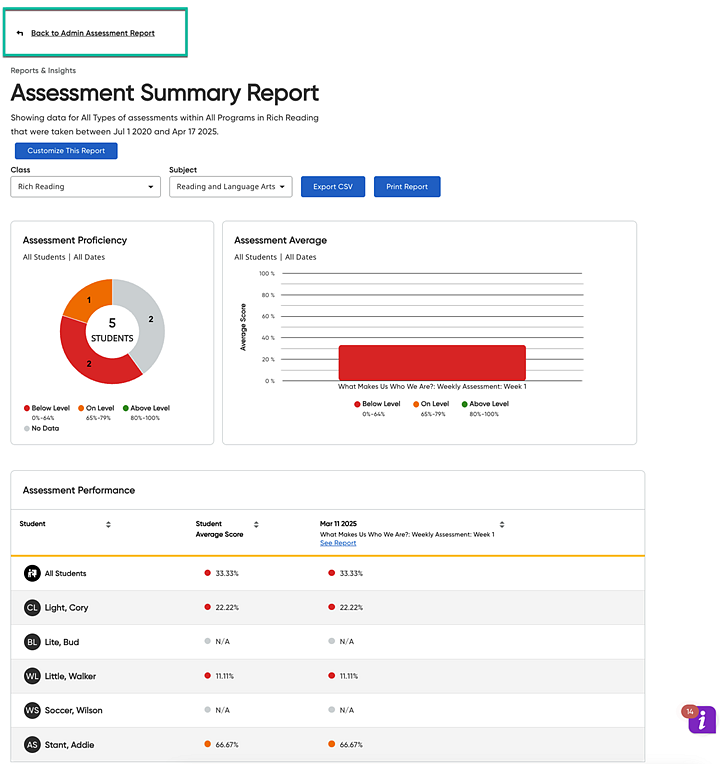
In the Teacher Assessment Report, you can view student data and their assessment details. You can use the Back link in the upper left to navigate back to the Administrator Assessment Details Report.
|
 This chart shows the
overall performance on the selected assessments for all school
groups, all schools, all lead teachers’ classes, or a single teacher’s
classes. Overall performance is categorized by the same three
performance levels in the Administrator Standards Report and both
the Teacher Assessment and Standards Reports for consistency.
This chart shows the
overall performance on the selected assessments for all school
groups, all schools, all lead teachers’ classes, or a single teacher’s
classes. Overall performance is categorized by the same three
performance levels in the Administrator Standards Report and both
the Teacher Assessment and Standards Reports for consistency.
 The bar chart component
allows you to see your organizations, average percent score by
assessment name starting with the earliest assessment on the left
of the bar chart.
The bar chart component
allows you to see your organizations, average percent score by
assessment name starting with the earliest assessment on the left
of the bar chart. 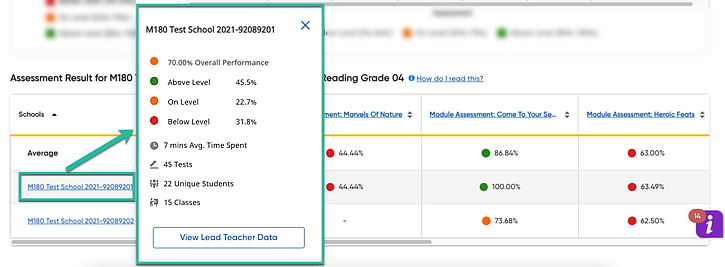


 This component allows
you to see in-depth details of the selected assessment, overall
performance, and average percent correct.
This component allows
you to see in-depth details of the selected assessment, overall
performance, and average percent correct. 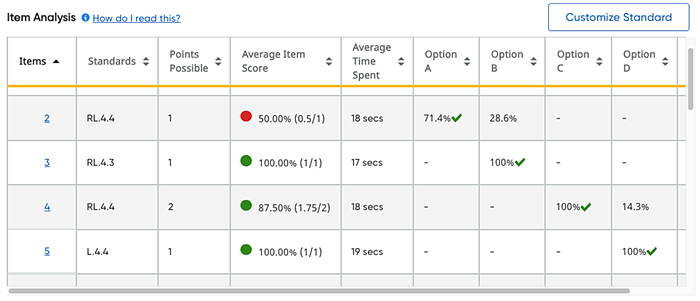 The data includes: