Web Tab
Information on the websites visited for each device is displayed under the Web tab on the Dashboard. This can be grouped from the drop-down by Website, Day or Category, when selecting Website or Category there is also the option to select the time period: 30 Days, 7 Days or 1 Day (Today).
The details displayed in the Web tab of the Dashboard depends on the installed Web Protection engine:
We are aware that due to data privacy considerations you may prefer not to display the visited URLs in the Web tab or Web Protection Reports for your clients. If this is the case please contact your Remote Management account manager who will disable this option and display anonymized data for your account. In certain regions, the URL data is turned off by default in accordance with local privacy laws.
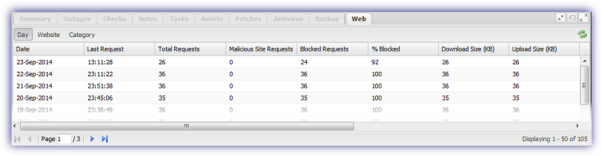
Web tab from Agent 10.4.4
There are a number of columns under each of the Web tabs sections, with these configurable via the column drop down.
|
Day |
Website |
Category |
|||
|
Option |
Description |
Option |
Description |
Option |
Description |
|
Date |
Date for the information |
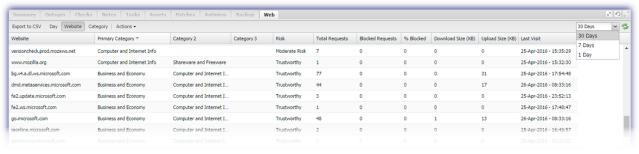
Website |
Domain name |
Category name |
|
|
Last Request |
Time of last request* |
A site may belong to multiple Categories. The main Category is recorded as the Primary with subsequent categories classed in order of priority as Category 2 or Category 3 |
Total Requests |
Total number of requests made* |
|
|
Total Requests |
Total number of requests made* |
Malicious Site Requests |
Number of requests made to malicious sites* |
||
|
Malicious Site Requests |
Number of requests made to malicious sites* |
Blocked Requests |
Total number of requests blocked* |
||
|
Blocked Requests |
Total number of requests blocked* |
Reputation Score of the site (where known) |
% Blocked |
Total number of blocked requests as a percentage* |
|
|
% Blocked |
Total number of blocked requests as a percentage* |
Reputation of the site (where known) |
Download Size (KB) |
Total size of data retrieved* |
|
|
Download Size (KB) |
Total size of data retrieved* |
Total Requests |
Total number of requests made* |
Upload Size (KB) |
Total size of data sent* |
|
Upload Size (KB) |
Total size of data sent* |
Blocked Requests |
Total number of requests blocked* |
Last Visit |
Date and time of last visited |
|
% Blocked |
Total number of blocked requests as a percentage* |
||||
|
Download Size (KB) |
Total size of data retrieved* |
||||
|
Upload Size (KB) |
Total size of data sent* |
||||
|
Last Visit |
Date and time of last visited |
||||
|
* These totals are based upon the selected time period filter. |
|||||
As Web Protection can return a vast amount of data for per device, the Web tab employs pagination with each page listing up to 50 entries. Information on the data returned from Web Protection is available in the FAQs section.
Movement between pages is controlled either by entering the target page number or using the navigation buttons
Columns
Each column has a number of unique sorting and filtering options available when clicking on the down selector in the column.
Every column has the option to choose the Columns to display in this section as well as Sort Ascending or Sort Descending and depending on the column additional Filters are also available.
Actions
Export to CSV
As it may be useful to retain a copy of the information contained in the Web tab we have included the output this date in a CSV format for specific device’s today and 7-day history reporting.
Simply choose the required section and click Export to CSV to initiate the download of the selection's data.
The CSV file maintains any column filtering or sorting, for example if the section was sorted by Total Requests.
Add to Whitelist or Add to Blacklist
In addition to managing URLs in the Web Protection policy we have included the option in the Website section to select a URL and from the Actions drop-down Add to Whitelist orAdd to Blacklist then select the Policy this setting is to apply to.
Web tab from Agent 9.16.0
|
Day |
Website |
Category |
|||
|
Option |
Description |
Option |
Description |
Option |
Description |
|
Day |
Date for the information |
Website |
Domain name |
Category name |
|
|
Last Request |
Time of last request* |
Category of the site (where known) |
Total Requests |
Total number of requests made* |
|
|
Total Request |
Total number of requests made* |
Reputation of the site (where known) |
Malicious Site Requests |
Number of requests made to malicious sites* |
|
|
Malicious Site Requests |
Number of requests made to malicious sites* |
Total Requests |
Total number of requests made* |
Blocked Requests |
Total number of requests blocked* |
|
Blocked Requests |
Total number of requests blocked* |
Blocked Requests |
Total number of requests blocked* |
% Blocked |
Total number of blocked requests as a percentage* |
|
% Blocked |
Total number of blocked requests as a percentage* |
% Blocked |
Total number of blocked requests as a percentage* |
Download Size (KB) |
Total size of data retrieved* |
|
Download Size (KB) |
Total size of data retrieved* |
Download Size (KB) |
Total size of data retrieved* |
Upload Size (KB) |
Total size of data sent* |
|
Upload Size (KB) |
Total size of data sent* |
Upload Size (KB) |
Total size of data sent* |
Last Visit |
Date and time of last visited |
|
Last Visit |
Date and time of last visited |
||||
|
* These totals are based upon the selected time period filter. |
|||||