MSP Manager Dashboard
You can use the product navigator at the top of the Monitoring Dashboard, or the link within a ticket to open the MSP Manager login page.
Although the hierarchical structure is the similar, please note the following differences in terminology between the Monitoring Dashboard and MSP Manager:
|
Monitoring Dashboard |
MSP Manager |
|---|---|
|
Client |
Customer |
|
Site |
Location |
|
Device |
Asset |
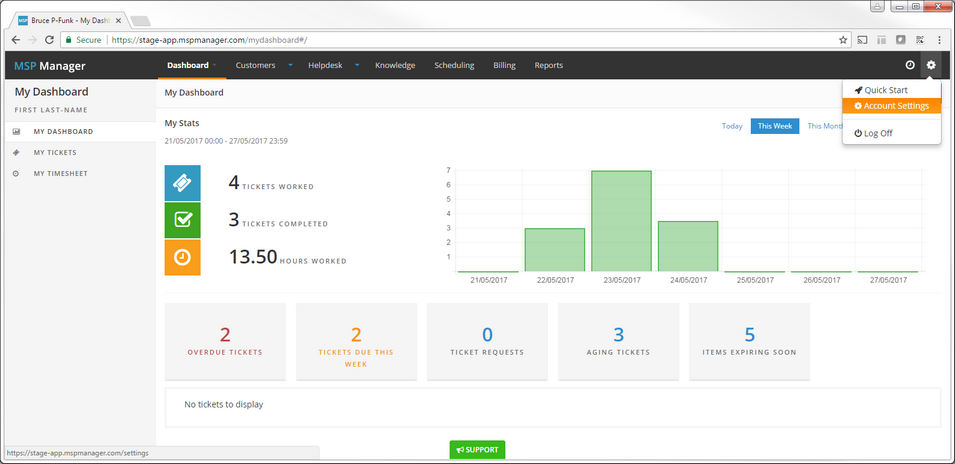
After logging in, you are presented with the My Dashboard view.
By default, this returns the My Stats overview section and from here you can go to My Tickets or My Timesheets for more detailed information.
Depending on your MSP Manager role the following tabs and sections are available.
|
Dashboard |
My Dashboard |
View:
|
|---|---|---|
|
Company Dashboard (Administrator only) |
View:
|
|
|
Customers |
Select a Customer to open their:
|
|
|
Helpdesk |
Open Ticket Views and Queues to display and manage tickets |
|
|
Knowledge |
View assets, store and access customer information via:
|
|
|
Scheduling |
View and add Appointments or setup a Schedule (where Configure Recurring Tickets permissions are enabled for your MSP Manager role) |
|
|
Billing (Administrator only) |
View each customer’s Service Utilization charges for the selected period. Expand a customer for a billing breakdown and run a Billing Batch to generate invoices |
|
|
Reports |
Create and export Reports:
|
|
|
Note: Those sections marked Administrator only are based on the permissions for the default MSP Manager roles. |
||
Customer and Location actions (add, edit and delete) are available in both systems, whilst Asset actions transfer from the Monitoring Dashboard to MSP Manager.