Feature Columns
Rather than check the details for each individual device from the Summary tab, the north pane columns are incredibly useful in providing at-a-glance view of the enabled features and alerting behavior across multiple devices.
This is accessed via the Columns menu above the north pane and enable the required feature. Once enabled additional columns appear on the Dashboard to indicate the status of the feature.
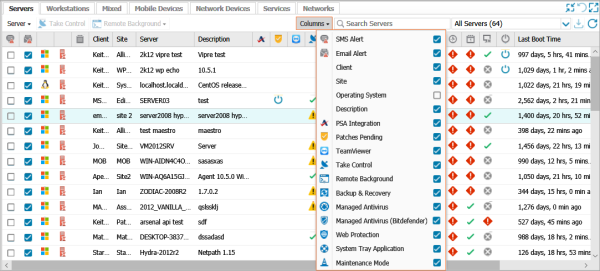
The following indicators are used on the Dashboard for each selectable column.
|
Servers and Workstations |
|||||||||||
|---|---|---|---|---|---|---|---|---|---|---|---|
|
Column |
Icon or text |
||||||||||
|
Email Alert |
|
||||||||||
|
SMS Alert |
|
||||||||||
|
Client |
Client name |
||||||||||
|
Site |
Site name |
||||||||||
|
Operating System |
Operating System details |
||||||||||
|
Description |
Entered during installation or device name if installed with the Site Installation Package. |
||||||||||
|
PSA Integration |
|
||||||||||
|
Patches Pending |
|
||||||||||
|
TeamViewer |
|
||||||||||
|
Take Control (TeamViewer) |
|
||||||||||
|
Remote Background |
|
||||||||||
|
Backup & Recovery |
|
||||||||||
|
Managed Antivirus - Bitdefender |
|
||||||||||
|
Managed Antivirus - VIPRE |
|
||||||||||
|
Web Protection |
|
||||||||||
|
System Tray Application |
|
||||||||||
|
Maintenance Mode |
|
||||||||||


To ensure the Dashboard north and south panels precisely match the requirements you can re-order the columns into whichever order you prefer. Simply drag the column to its new location and drop to apply.
Visit Dashboard Iconography for a list of the icons used in the Dashboard.
These settings only apply to the current Dashboard session. They reset when the browser reloads.