Lesson One: Designing with Flowcharts
As a programmer, you are often given a problem to solve or a task to complete. You will need to write program code based on the problem's description, purpose, and goals, The exact sequence of steps your program takes to solve a problem is called an algorithm. While computer algorithms are eventually written in a programming language, you might use other tools to help design or plan your code first.
 Sometimes, things that seem natural and easy to a human are a little difficult to translate into computer code. Think about the string "Live long and prosper". If you were asked to identify the first space in the string, you would immediately point to the character right after "Live". But how would you write an algorithm so a computer program would also identify the first space in a string?
It can be hard to leap right from a problem description to a fully coded solution. Programmers may want to go through a design phase before starting to write code. During this design phase, you can plan out your overall approach or logic without worrying about too many details or the exact syntax of a programming language. In this lesson, you are going to learn about flowcharts, which are diagrams that can help visualize how to write your code.
Reminder - Understand the Problem First
You might be tempted to dive into a design or coding challenge without really studying the problem you are trying to solve first. As a result, the program you write might not address the actual problem! Be sure you understand a problem's purpose - why does it exist and what needs to be solved? What is a high-level description of the problem, based on the purpose? What are the observable or measurable goals or results that, once reached, will solve the problem?
Use these three key problem understandings to guide your design efforts!
Introducing Flowcharts
A flowchart is a useful picture that helps visualize your logic as a series of easily understood questions, answers, and actions. Simple flowcharts use three symbols. There are other, more advanced symbols used in formal flowcharts, but you can get quite a bit of use out of these three simple shapes!
| Name | Description | Example |
|---|---|---|
| Rectangles | A rectangle represents one step that your algorithm needs to take. For example, you might need to perform a calculation, update a variable, or print something on the screen. | 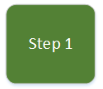 |
| Diamonds | A diamond represents a decision point in your code. You may ask a true/false or yes/no question that could be coded with an if statement. For example, you might ask "Is a variable greater than 0?" However, your diamond could also represent a more general question like "Did the user enter valid input?" or "Has this loop finished ?" |  |
| Arrows | Arrows represent program flow between rectangles and diamonds. If a rectangle or diamond represents a coded statement or series of statements, then arrows leaving one block and pointing at another block show you that the program flow should move from the first block to the second. Arrows may contain helpful text that describes the program flow. |  |
In addition to these basic symbols, the beginning and ending points are often labeled with "Start" and "End" or similar notes near the arrows where the algorithm flow stops and starts. Sometimes, the start and end points are represented by circles, but we will simply use text notes if those endpoints are not obvious.
Now, consider this simple problem statement:
"Get a number between 1 and 10 from the user, verify the user input, and then print that number to the screen."
How could we create a flowchart to visualize this process? Let's start very simply.
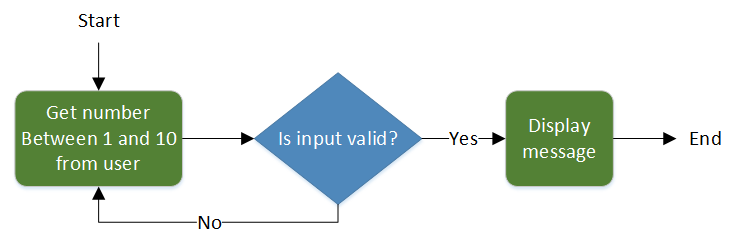
Our first step (rectangle) is to get the number from the user. The outgoing arrow shows the program flows to the diamond to the right. We then ask if that number is valid. If the answer to the question is no or false, we follow the "No" arrow back to the first step, which will get another number. If the answer to the decision is yes or true, we follow the "Yes" arrow to the right and display the message in the final step. Notice that you can label arrows with helpful notes that say why the program is flowing in that direction!
Would this flowchart be useful when you are ready to write the code? Perhaps, but you might prefer to add a bit more detail to your flowchart. Let's rewrite our flowchart to contain more detailed steps, decisions, and program flow.
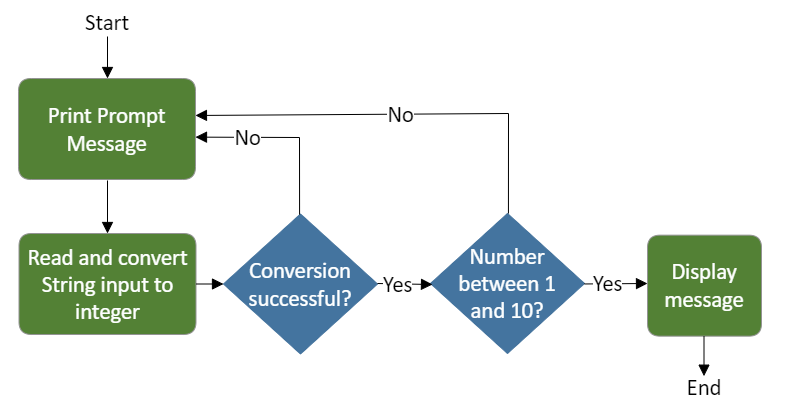
As you trace the program flow through this flowchart, you probably feel "closer" to the code you will need to write. The individual steps and decisions are very familiar as you already know how to write input conversion logic with input() and str(). However, we've still left off some details. For example, the flowchart does not specify the kind of loop you might use (like a while loop or for loop) to continue prompting the user until a valid number is received.
Do you need more or less detail in a flowchart before starting to write code? The answer depends on your experience and familiarity with the program logic you need to write. If you are comfortable writing the algorithm without any flowchart, you might leap right from the problem description to the code. If you just need a simple flowchart to help organize your big-picture steps, then the first flowchart might be enough. But if you feel like you need more guidance, the second flowchart or even another version with more details might be a big help.
When you are creating a flowchart for yourself to help get started on a program, your goal is to help you write good code that meets the requirements. Find the right mixture of elements, labels, and detail that works for you! Your flowchart should give you a clear idea of how you can write code to meet the program requirements.
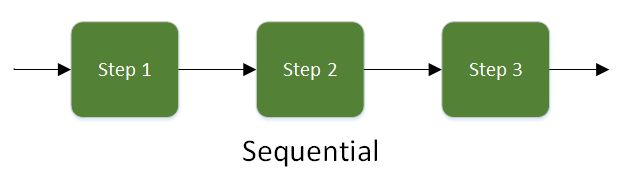
Sequential Algorithms
Some algorithms may be described as sequential. Sequential algorithms do not have to make any decisions or repeat sections of code in a loop. Each step will execute in the order they appear in the program code. Therefore, a sequential flowchart is simply a series of rectangles, connected by arrows.
Branching (Selection) Algorithms
 Branching algorithms (or selection algorithms) will execute some steps based on
decision-making logic such as if, elif, and else statements. Branching flowcharts naturally contain diamonds to represent those decision points. The program flow, represented by arrows, makes one pass through the steps and selects individual steps to execute based on the decisions.
Branching algorithms (or selection algorithms) will execute some steps based on
decision-making logic such as if, elif, and else statements. Branching flowcharts naturally contain diamonds to represent those decision points. The program flow, represented by arrows, makes one pass through the steps and selects individual steps to execute based on the decisions.
In this example, you can see that if the condition is true, only Step 1 is executed, and the program flow will continue after Step 2. However, if the condition is false, only Step 2 is executed and Step 1 is skipped. This diagram represents a classic if / else chain of logic. Step 1 contains the statement(s) inside the if body and Step 2 contains the statements(s) inside the else body.
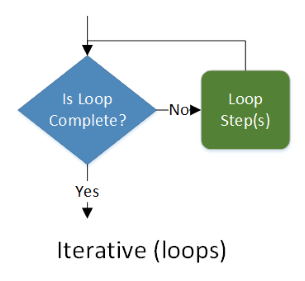 Iterative Algorithms (Loops)
Iterative algorithms will use for loops, or while loops to repeat sections of code until the task is complete. The loop's test expression is normally represented by a diamond, and the body of the loop can be found by tracing the arrows after the decision point through a series of steps and then back to some earlier element in the flowchart.
Creating Algorithms with Sequencing, Branching, and Iteration
You can create any algorithm using a combination of sequencing, branching, and iteration. Some algorithms have only a few sequential steps, while others are very complex with many paths through branching and iterative logic.
You may choose to represent a complex part of your logic as a single step on a high-level flowchart. You can then create smaller flowcharts with low-level details to explain exactly how a single step in the overall algorithm will work.
Example - Finding the First Space in a String
At the beginning of the lesson, we asked how a computer algorithm might find the first space in a string. Let's create a flowchart to visualize how that algorithm might work.
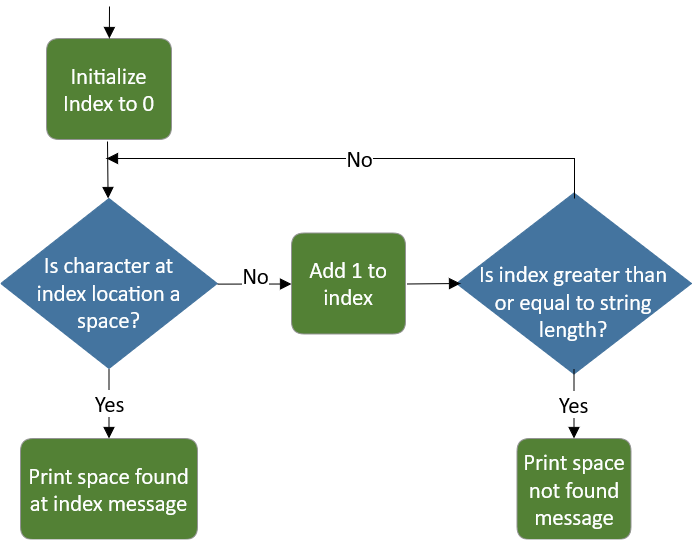
Both this flowchart and the paragraph below give the same description of the algorithm:
"To search for a space in a string, we first initialize some index to zero. We then use this index to check the character at that location within the string. If that location contains a space, we are done, so return that index value to represent the location of the space. If not, add one to the index. Then check the index to see if we have passed the end of the string. If not, go back and check the next characters. Otherwise, we have searched the entire string and not found any space, so just return -1."
Which description is easier to read? It depends on your personal preference, but many prefer the visual approach. Flowcharts are great tools for developing a step-by-step description that can then be easily translated into computer code.
Flowchart Tools
Professional software engineers often use dedicated software tools to create and manage flowcharts. You can install local programs like Microsoft Visio or search for "online flowchart tool" in your favorite web search engine. You will find many free, online options. Some may require you to create a free account, while others can be used directly with no account. These online tools should allow you to save your flowchart in a variety of formats like *.png (an image) or *.pdf (an Adobe document). One big advantage of using a software tool is that your flowchart can be easily changed by dragging shapes and arrows to new locations.
Of course, simply using pencil-and-paper or a whiteboard also works if you don't want to use local or online software tools. Remember, the flowchart is for your use when preparing to write code, so use a tool and format that works best for you. This course does not require you to turn in flowcharts as part of any graded activity. However, your teacher may choose to request flowcharts from you in a specific format as an additional exercise.
Work with Me: Hungry Flowchart
In this exercise, you are going to practice designing your own algorithm with a flowchart. Here is your problem statement:
"You are at home on Saturday and you are hungry. Your pantry may or may not contain food. Your refrigerator may or may not contain food. The store will always contain food. You should try to find and eat food from the pantry, refrigerator, or store in that priority order until you are no longer hungry.
For example, you will check the pantry first, and if there is no food available, move on to the refrigerator. Each time you grab food and eat from a location, check to see if you are still hungry. If so, check to see if there is more food in the same location. If you are no longer hungry, you are done."
How might you represent this process as a flowchart? What specific steps and questions and questions will be included? There is no single, correct answer. However, you can still think in terms of logical steps and decisions to be made.
Use pencil and paper or any available software tool to create your flowchart. Be sure to use the correct shapes for steps and decisions and label your starting and ending points, if needed.
To test your algorithm, trace your way through the flowchart several times, imagining what will happen when the pantry and/or refrigerator is out of food. What will happen in each case if you do get food and are still hungry afterward? Be prepared to describe your flowchart with your class or your teacher, if asked.
Keep your flowchart for use in the next lesson!