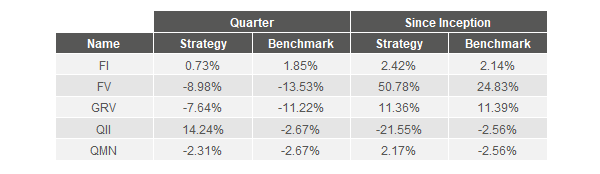
Averaged across clients and gross of fees, four of five strategies outperformed during the quarter, and three of five have outperformed since inception.
 By some metrics, 2018 was historically bad for investors. There was nowhere to hide, as total returns after inflation were negative for all major asset classes: US large-cap stocks (-6.5%), US investment-grade bonds (-2.2%), commodities (-13.2%), real estate (-5.9%), and global equities (-16%).1 All five asset classes have not declined simultaneously since 1981. Allocating to riskier assets, like emerging markets, high-yield bonds, and small cap equities, only hurt returns further.
It’s worth clarifying that 2018 wasn’t a particularly bad year in terms of depth of declines. A 60% stock/40% bond portfolio had a total return of -7.7% in real USD in 2018, compared to a -24.1% decline in 2008.2 Since 1900, US large-cap equities have experienced 26 years with worse declines than 2018.3
Instead, the real problem with 2018 was the breadth of declines, as assets declined indiscriminately. This, we think, is largely a product of the easy-money era since the financial crisis. The Fed and other central banks have had an explicit policy of boosting risk-asset prices through low interest rates and quantitative easing. Thus, the vast majority of global assets were historically expensive going into 2018. As we begin to see signs of a return to monetary policy normalcy, assets are, unsurprisingly, repricing lower.
In early 2018, we noted in our 4Q17 investor letter:
We’re in an equity goldilocks zone. A deteriorating economy likely causes market declines (via falling earnings and bankruptcies). Yet counterintuitively, an economy that does better may cause market declines as well (via rising inflation and interest rates that lead to lower valuations).
International markets experienced declines largely due to economic deterioration. On the other hand, growth in the US remained strong, but US stock and bond markets experienced declines nonetheless due to tightening monetary policy. Such is the conundrum when assets are priced for perfection. Any change, either for better or worse, can trigger a fall.
Bireme clients who utilize our full investment suite are cushioned from risk-asset repricing in three ways. First, we use
dynamic asset allocation to overweight asset classes with more attractive long-term prospects, an essential investment component for these fraught times. Second, Fundamental Value, our flagship US equity strategy, is less than 90% invested today, and has been since inception.
4 (Despite this handicap, FV has outperformed the S&P 500 by 26% before fees.) This cash cushion minimizes the impact of market drawdowns, and leaves us with dry powder to put to work in times of greater opportunity. Third, our market-neutral strategies can enjoy positive returns regardless of the direction of financial markets.
For better or worse, passive investors necessarily receive the return of the market. However, active investors are not subject to that same restriction. Even if we’re correct that the future is likely a low-return environment for major asset classes, we hope to earn Bireme clients adequate absolute returns nonetheless.
Counterintuitively, we look forward to further volatility, as this gives us an opportunity to reallocate client funds toward riskier and higher-yielding asset classes at better prices.
Quantitative Index Investing
QII had an excellent quarter, returning 14.2% gross vs a -2.7% loss for its benchmark, the HFRX Equity Market Neutral Index. For the year, QII returned 15.3% vs a benchmark return of -3.2%.
Given QII’s strong return for the fourth quarter (+14.2%) and the collapse of the S&P 500 (-13.5%), one would expect that QII averaged a net short position. However, QII averaged a 47% long position. QII was long on 37 business days (59% of the quarter) and short on only 17 business days (27% of the quarter).
QII’s strong performance came from excellent timing, rather than from a constant short position. On the 36 days QII was long, the S&P lost only -1.0% in total, while on the 17 days QII was short, the S&P plummeted -12.0%.
Since inception, QII has been directionally correct on 47% of business days that it has held a position. However, there’s a pronounced dichotomy in the likelihood of a correct prediction depending on the magnitude of the market’s returns. When the market moves less than 1% either up or down, QII has been directionally correct only 46% of the time. On the other hand, when the market moves more than 1%, QII has been directionally correct 57% of the time.
This dichotomy is unsurprising. Most of the market’s small, day-to-day movements are largely random. We should expect predictability to be low on those random-walk days. On those days, the market’s movement is just noise -- there’s no signal. However, when the market makes a strong move in one direction, it is likely to be responding to built up pressures and underlying factors. These moves are less random, and thus more predictable for QII.
Since 1900, 25% of business days have had a return magnitude greater than 1%.
3 That’s not an artifact of ancient history -- since 2000, the proportion of volatile days has been even higher (28%). However, since QII’s inception in June of 2016 until the end of the third quarter of 2018, only a meager 10% of days saw market moves of more than 1%. In the fourth quarter of 2018, however, that percentage shot up to 44%. Unsurprisingly, QII had its most profitable quarter to date.
As we’ve discussed before, in many ways, the past few years has been one of the most sanguine stretches in market history. We view the lack of volatility in 2016, 2017 and most of 2018 as an aberration. QII should continue to benefit in both relative and absolute terms should a higher-volatility regime persist.
Fundamental Value
The Fundamental Value strategy returned -9.4% net of fees in Q4, a disappointing result on an absolute basis but an outperformance of 4.1% relative to SPY, the S&P 500 ETF. For the year, FV lost -1.1% after fees vs SPY’s decline of -4.6%. Since inception, the strategy has outperformed by 6.3% annually after fees, a result we work hard every day to sustain.
The sell-off in stocks in Q4 was broad-based, and most of our stocks dropped in line with the market. A notable exception was Apple, whose stock fell about 30% in the quarter on disappointing FQ1 guidance. The miss was mostly due to weak demand in China, but this was not a situation specific to Apple: analysts estimate a
12-17% decrease in Chinese Q4 smartphone shipments. However, Tim Cook also described a shortfall of iPhone upgrades compared to expectations in some developed markets.
While the iPhone replacement cycle may be lengthening, we are not particularly concerned. The data shows that these customers are not switching to Android. Even in China -- historically an Android stronghold --
data indicates the iOS installed base is stronger than ever, capturing 25% of usage. US figures show similar stability at
45% to
55% share.
So while iPhone users may be buying fewer new phones, they remain within the iOS ecosystem. This is key, as the size of the active installed drives Apple’s services and accessories segments. These segments have grown from $22 billion in sales for calendar year 2013 to $45 billion in 2017, and we expect them to generate more than $90 billion in revenue by 2023. This will allow Apple to grow profits despite flattening iPhone sales.
Regarding Apple’s “Greater China” results, this quarter’s decline in revenue is not unprecedented. Greater China sales were 13% lower year-over-year for FQ3 2013, and shrank for five consecutive quarters starting in early 2016. Both these periods coincided with compelling discounts in Apple stock.
5
We remain long Apple. It is not our largest position, but we remain confident in the long-term future of the company and think it is quite cheap at 11x PE net of cash.
We were active in the fourth quarter, as the market volatility presented us with more than our usual share of opportunities. We made two new investments: Bayer AG and Facebook. As is often the case for our new investments, both companies face negative investor sentiment and declining valuations. They face negative public sentiment as well, even
appearing6 on USA Today’s list of America’s Top 20 most-hated companies. In both cases, we think that public opinion has leaked through to stock market valuations in an irrational way, presenting upside for investors willing to focus on business value and ignore all else.
We have watched Facebook from afar for some time. We have long been impressed at the pace they have grown the business, with revenues increasing from $5 billion to about $55 billion over the past six years. That growth has fallen to the bottom line as well, with profits multiplying from $1 billion to $20 billion.
For much of that time, Facebook was richly rewarded for this growth, trading at nosebleed valuations of 60 to 100 times earnings. Thus, it was with some surprise that we watched the
mounting scandals drag down the stock over the past six months. But despite the move in price from $220 to $140, we believe the bad press is not material to the long-term health of the business.
The issues are real: Facebook’s platform did enable Russian interference in the 2016 election and Myanmar persecution of the Rohingya. And the company really did expose data to bad actors like Cambridge Analytica. But while Facebook must end this sort of activity on their platform, there is scant evidence of a change in user behavior since the first story broke in Q1 2018. Facebook’s North American monthly active users have grown since that time, and currently number 242 million (i.e., nearly every adult on the continent). Facebook’s public image amongst Americans is even less likely to impact Instagram, the key growth vehicle of the business over the next five years.
57% of Americans don’t even know the company is owned by Facebook, and
80% of users are outside the US.
We purchased Facebook stock in the low 130s, at about 18x earnings. This is a small premium over market multiples, which we are happy to pay given the superior quality and growth of the business.
Our second investment in Q4 was Bayer, parent company of the much-hated Monsanto. Bayer was -- prior to the Monsanto acquisition -- a solid, well-liked pharmaceutical company that
sponsored top Bundesliga teams. They still support the football club, but the public goodwill appears to have evaporated since the announcement of the Monsanto deal, with Bayer shares underperforming the DAX by about 40%. We suspect this is due to European shareholder
7 antipathy for genetically modified crops, which we don’t find rational given their inherent safety and the
need to increase food production by 60% over the next 30 years.
There are risks to the Monsanto business. For example, thousands of former Roundup users are suing the company on the claim that it caused their cancer. The company (and investors) are taking the lawsuits particularly seriously given a
$289m verdict in favor of an early plaintiff.
But like in Facebook’s case, we think Bayer’s long-term cash flows will be unaffected by today’s negative headlines. Monsanto’s products are desperately needed by farmers, and we don’t think it’s likely that Roundup causes cancer. As the judge in the above case
noted, all of the regulators in the world except for one have found Roundup to be a safe, non-carcinogenic product.
A few years hence, we believe Monsanto and Bayer will have grown profits substantially and much of investor focus will be back onto the strength and track record of Bayer’s pharmaceuticals business. If this is true then our investors should do quite well on their November purchases, which were made at about 10x free cash flow.
We are grateful for your business and your trust, and a special thank you to those who have referred friends and family. There is no greater compliment.
- Bireme Capital
1 Total returns of S&P 500 Index, Bloomberg Barclays US Aggregate Bond Index, Bloomberg Commodity Index, S&P US REIT Index, and MSCI All Country World Ex-US Index, all adjusted by CPI. Data from Bloomberg.
2 60% MSCI All Country World Index, 40% Bloomberg Barclays US Aggregate Bond Index.
3 Dow Jones Industrial Average prior to 1936 and S&P 500 since.
4 FV invests based on a bottom-up analysis of opportunities in individual securities, and may move to become more or less invested at any time.
5 Guidance for FQ3 2013 was released on 4/23/2013 and for Q2 2016 was released on 1/26/2016. Buying the stocks at the close on those days and holding for two years would have resulted in total returns of 133.5% and 78.2% respectively, vs 39.2% and 56.9% for SPY. Data from Bloomberg.
6 In the case of Bayer, through their Monsanto subsidiary.
7 More than 60% of Bayer shareholders are European.