Having trouble viewing this email? View as a webpage.
|
We’re proud to report that, as of the middle of the second quarter, Bireme has been actively investing for over a year. There have been trying and frustrating times, but by and large, starting a business has been exciting and rewarding. We sincerely thank you for your trust. We couldn’t have done it without you.
We know you have many options when it comes to investment management, and we’re honored and humbled that you have chosen us. That trust comes with an obligation, and it is one that we feel acutely. We will continue to work extremely hard to protect and grow your assets.
Averaged across clients and gross of fees, two of five strategies outperformed during the quarter, and four of five have outperformed since inception.
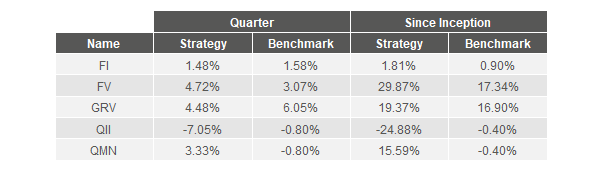
Fundamental Value, Bireme’s US equity strategy, had a solid quarter, besting a strong performance of 3.1% by the market with a 4.7% gross return of its own. This brings gross year-to-date returns up to 11.1% versus a 9.2% return for the S&P 500.
This quarter, there was one major addition to the FV portfolio: Cogeco, a Canada-based provider of cable internet and TV. We bought shares of both Cogeco Communications, the operating company, and Cogeco Inc, an upstream holding company.
Selling internet and TV access through cable lines is a good business. It is often a local monopoly, and where it is not a monopoly it is usually a duopoly, with competition from one other firm with inferior technology such as DSL. This business tends to be more stable and profitable than selling mobile wireless internet access, where there tends to be 3 or 4 scale players ruthlessly competing with heavy marketing and discounting. Many fortunes have been made in the cable business.
Over the last 5-10 years, investors have discovered the quality of this industry segment, and significantly bid up the prices of US cable firms, to the point where these capital-intensive businesses trade at 9-12x EBITDA and often 20+ PE ratios.
In Cogeco, we believe we’ve found a business of similar if not higher quality, trading at a much lower valuation of 6-7x EBITDA and a mere 10-12x free cash flow.
Cogeco’s cable and internet businesses are very strong in the markets where they compete. With cable assets in Quebec Province, Ontario, Connecticut, Pennsylvania, West Virginia, South Carolina, and Florida, they are geographically diversified but focused on North America. Their Canadian cable business generates the majority of EBITDA, and they compete mainly with Bell Canada (BCE) in these markets.
They provide internet speeds of 150 Mbps or higher in nearly 100% of the markets they serve. Often, they are the sole provider of speeds higher than 10 Mbps, a level below which many consumers will not even consider subscribing. It is no surprise then that they have been gaining internet subscriber market share, from 40% to 44% in Canada and from 35% to 45% in the US, since 2013.
Fundamentally, buying a stock is an arrogant action—you imply that you are more knowledgeable than the seller. But are you? What might they know that you don’t? We frequently try to get into the mind of the seller when we buy a stock, in order to make sure we are not the proverbial patsy at the poker table.
In the case of Cogeco, one bearish Wall Street analyst is worried about BCE’s coming fiber build out in Canada. We believe this a concern likely shared by other sellers of the stock. The thought is that a legitimate competitor to Cogeco’s cable internet will hurt pricing, margins, and customer retention. But to us, the concern seems overblown.
For one, Bell’s fiber rollout has consistently been slower and less impactful than expected. Originally, analysts had expected 70% of Cogeco’s Canadian footprint to be serviced by high speed BCE fiber internet by 2017. Currently, that number is more like 45%, almost exclusively in Quebec, and BCE has said they are focusing on major cities like Toronto for the next year or two. At current rates, BCE’s rollout will take another 6-8 years before it is complete.
In fact, BCE’s rollout may fail to reach Cogeco’s full Ontario footprint. This is due to the low population density of towns that Cogeco serves (many of less than 30,000 residents). A further difficulty is presented by Ontario’s requirement that most fiber be installed underground, a much more expensive proposition than hanging it on poles as allowed in Quebec. We believe this combination of expensive underground installation and low population density might making running fiber to these small towns cost prohibitive.
Finally, BCE has not been undercutting Cogeco’s pricing even where they have installed fiber. In most cities in Quebec that we studied, they are offering $80 for 50 Mbps vs Cogeco’s $60 for 40 Mbps. This pricing strategy indicates BCE is focused on upselling current DSL subscribers as opposed to taking Cogeco’s subscribers. We think this strategy allows for both firms to generate substantial profits in these duopoly markets.
Cogeco Inc and Cogeco Communications combined are roughly a 7% weighting in the Fundamental Value portfolio as of this writing.
On the dynamic allocation front, results have been mixed. Clients benefited from a heavy weighting towards international equities (GRV: +4.5%). However, clients are underallocated to US equities, and despite increasingly rich valuations, US equities in general (+3.1%) and FV in particular (+4.7%) once again had strong quarters.
We continue to believe that US equities are priced for perfection, with rich valuations built on top of record profit margins. These record profit margins are partially due to the difficult employment market conditions of the past 8-10 years. During the financial crisis, millions of Americans lost their jobs. Given an oversupply of job seekers and an undersupply of jobs, corporations were able to lower the share of their revenue they paid to their workers, and keep more in profits. However, with the US economy at or near full employment today, the share of labor compensation as a percentage of GDP has begun to creep off its record low. The profit tailwind has begun to turn into a headwind.
Furthermore, we worry that the changing distribution in ownership of US equities could exacerbate the next market downturn. Ownership has becoming increasingly concentrated in passive vehicles, rising from just 12% of US equity fund assets in 2000 to 42% in 2017. Passive investments are, by definition, made without consideration of economic concerns, such as valuation and business prospects. Passive buyers have not made a reasoned investment decision, deciding that US equities offer attractive investment prospects. Instead, they have merely invested on faith in ever-increasing stock prices; they have agreed to participate in the future investment returns of the market, whether those returns are high or low.
This enormous new class of investor has not yet been tested by a market downturn. During the inevitable next drawdown, some passive investors will prove to be truly passive, and will continue to hold their investments. However, many more will not. Many will decide, as have other investors in countless past financial crises, that they no longer wish to participate in market returns, because they have taken too much risk, or they can’t stomach the loss in wealth, or they have lost faith in US stocks. Many passive investors have fired their human financial advisors in an effort to cut costs. They are without an advisor to lend them calm and perspective during trying times. As is human nature, many passive investors will panic and hit the sell button.
But who will they sell to? Active value managers, the traditional buyers of equities during market drawdowns, are greatly diminished in size. Value managers have lost significant assets because of the flood to passive, as well as the unprecedented underperformance of value investing over the past decade. Those that persist have been forced to carry low levels of cash lest they miss out on market returns. And finally, these managers are likely to increase their exposure to US equities only at valuations that are historically attractive, rather than the near-record high valuations prevailing today. Therefore, the ability of value managers to support the market is distressingly limited, and would only come at far lower prices.
Bireme clients who utilize our full investment suite are cushioned from any US equity drawdown in three ways. First, we continue to drastically underweight US equities. Second, in contrast with passive investors who are by definition fully invested, FV has been less than 90% invested over the last year. (Despite this handicap, FV has outperformed the S&P 500 by more than 12% since inception.) This cash cushion minimizes the impact of any market drawdowns, and leaves us with dry powder to put to work in times of greater opportunity. Third, our market-neutral strategies can enjoy positive returns regardless of the direction of financial markets.
With our underweighting to US equities at the account level, our dry powder at the US equity strategy level, and our overweighting to our market-neutral strategies, we expect to emerge from any downturn relatively unscathed. Further, we expect to be one of the few buyers able to profit from the lower prices engendered by any market dislocation. We do not know when passive investors will be tested, but we know they will be. That day draws inexorably closer with each passing quarter and each record high. In the meantime, we are content to look foolish for missing out on the ongoing US equity rally. That is a small price to pay to protect our clients’ financial futures.
Below you'll see a chart of the performance of your investments (in red) compared to a relevant benchmark (in gray). Benchmarks are investable assets chosen because they are most comparable to a given strategy. Since we charge fees at the account level, account returns are shown net of fees, while individual strategy returns are shown gross of fees.
We are grateful for your business and your trust, and a special thank you to those who have referred friends and family. There is no greater compliment.
- Bireme Capital
|
In the chart above, the performance of your entire account is compared to a unique, synthetic benchmark. To create your synthetic benchmark, we make an investment in each of the individual strategies' benchmarks proportional to the center of your allocation bands. This serves as a proxy for the performance of your investment portfolio had you not invested with Bireme.
Relative performance is due to a) relative performance of the individual strategies, and b) dynamic allocation at the portfolio level (under- and over-weighting strategies relative to the center of your allocation bands).
Your account return as calculated above is net of accrued fees (including performance fees, if any). The return of each individual strategy is before fees, since at Bireme you pay the same fee regardless of how much money is invested in each of our strategies. Our transparent, one-layer fee structure gives us unparalleled incentive alignment with our clients. We don't get paid for selling you high-fee products, for selling your order flow, or for generating commissions in your account; we get paid for good performance, which is what matters to you.
The synthetic benchmark is an unrealistically aggressive target because it isn't achievable in practice: the synthetic benchmark doesn't incur transaction costs (slippage and commissions) or the management fees you would pay another advisor.
Our goal is not just to prepare our clients for an uncertain future, but to do it better than anyone else. Over the long term, if we can keep pace with the synthetic benchmark after paying our real-world costs, we think we'll have achieved that goal.
|
The table above shows the allocation of your funds among our strategies. Target allocation shows the allocations as of the last portfolio rebalance, while actual allocation shows the allocations as of the quarter end. Changes in the value of your investments will result in actual allocations that temporarily drift from target allocations, and may result in allocations slightly outside outside your band minimum or maximum. This is normal and expected. We generally look to rebalance when market conditions warrant a change in investment strategy, or your target differs from your actual allocation by more than 5%.
|
Fixed Income Sector Selection
|
Fixed Income Sector Selection (FI) is our US fixed income strategy. FI's benchmark is the iShares Barclays Aggregate Bond Fund ETF (AGG), which seeks to track the investment results of an index composed of the total US investment-grade bond market.
|
Fundamental Value (FV) is our flagship US equity strategy. FV's benchmark is the SPDR S&P 500 ETF Trust (SPY), which seeks to track the investment results of an index composed of the 500 largest public companies in the US.
|
Global Relative Value (GRV) is our international equity strategy. GRV's benchmark is the iShares MSCI All World Ex US ETF (ACWX), which seeks to track the investment results of an index composed of large- and mid-capitalization non-US equities.
|
Quantitative Index Investing
|
Quantitative Index Investing (QII) is one of our market neutral strategies. QII's benchmark is the Hedge Fund Research Institute's HFRX Equity Market Neutral Index (HFRXEMNI), an index of investable equity market-neutral hedge funds.
|
Quantitative Market Neutral
|
Quantitative Market Neutral (QMN) is one of our market neutral strategies. QMN's benchmark is the Hedge Fund Research Institute's HFRX Equity Market Neutral Index (HFRXEMNI), an index of investable equity market-neutral hedge funds.
|
|
|
|
|
|


