Bireme has had a strong start out of the gates. Averaged across clients and gross of fees, three of five strategies outperformed during the quarter, and four of five have outperformed since inception.
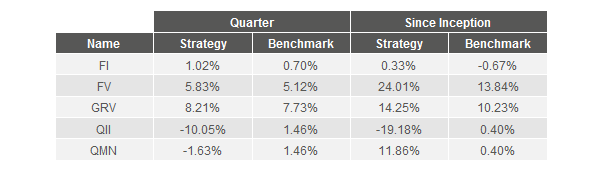
FV gained 5.83% before fees in Q1, edging out its benchmark, the S&P 500 ETF, which returned 5.12%.
We made one new investment in the quarter, the French holding company Bollore SA. We had been following Bollore for about two years, ever since a positive report on the firm was released by noted short seller Muddy Waters. In this report, a rare buy recommendation for the outfit, Muddy Waters claimed that the effective share count of Bollore was less than one half of the official number. This is important, as a halving of the share count doubles the value per share, all else equal. If Muddy Waters was right, and other investors were relying on the public share count, the stock might be undervalued indeed.
After watching the stock slide from 5 euros per share to 3 euros since early 2015, we decided the time was ripe to match Muddy Waters’ work with our own research. Despite a very complex corporate structure, we were able to approximate and confirm Muddy Waters’ view that Bollore SA essentially owned more than half of its own shares. At most firms, these are called “treasury shares” and excluded from the share count. In Bollore’s case, however, they are owned indirectly through a series of holding companies, and are not excluded. This leaves the share count artificially inflated.
Having confirmed the share count issue, we set to work on understanding the quality of the business itself. We came away impressed. The largest business segment focuses on logistics, helping organize air and sea shipping for manufacturers worldwide, while also owning some of the ports that receive these (and other) shipments. This business has increased operating income from $195m to $545m since 2005.
With the capital generated from the logistics and other business, Chairman and CEO Vincent Bollore has made a number of successful investments over the years, with the current largest positions in French media companies Havas and Vivendi. As a result of Mr. Bollore’s stewardship, book value per (official) share has increased from 0.33 Euros in 1995 to 3.95 Euros in 2015, equivalent to growth of 18% per annum. We like the prospect of investing alongside Mr. Bollore, especially given a current price that is at a large discount to our estimate of intrinsic value.
To demonstrate this discount, consider the earnings multiples of Bollore’s competitors in the logistics business:

When excluding treasury shares, we estimate that Bollore trades at roughly ten times 2016 earnings per share, less than half the median of this group. We think Bollore SA will see strong returns to investors if a portion of the discount closes.
During the quarter, there were three significant contributors to Fundamental Value’s returns: Apple, Samsung Preferred Shares, and 21st Century Fox.
In Apple’s case, the market seemed to focus on the firm’s return to sales growth in the holiday quarter. This, combined with
positive rumors on a fully-redesigned iPhone 8 pushed the stock to all time highs, up 24%.
Samsung’s preferred shares appreciated 22% during the quarter, from $593 to $722. Investors have perhaps begun to appreciate the strength of Samsung’s current business, which posted an all time record 29.4T won of profit in 2016, up 11% from 2015 despite the negative effect of the Note 7 fiasco.
Fox’s business is also very strong, with operating profits hitting a fresh high of $1.9B in the fourth quarter, up about 10% compared to Q4 2015. The strength is broad-based, with all three major operating segments seeing profit increases of 6-20% on a trailing 12 month basis. On a more granular level, Fox News continued its
domination of TV ratings, posting a
27% increase in Total Day viewers in Q1. Fox News has now spent 61 months atop the ratings rankings for cable news.
There were no material losers in the FV portfolio for the quarter, a result which we think is not particularly meaningful. Our goal is long term outperformance, and the randomness of markets will one day bring losing quarters for both individual positions and the portfolio as a whole, as they have done for some of our other strategies.
QII had an extremely disappointing quarter, with a -10.1% loss vs a 1.5% gain for its benchmark. QII held a net short position on most of the days in the quarter. This caused the disappointing performance as US equities were up sharply during the period.
On many days during the quarter, QII expected the distribution of daily returns to have a negative skew, with a positive median but a negative mean. Thus, QII was projected to lose a small amount of money on the average day, but make large profits on days when the market fell precipitously. Sudden and precipitous falls erasing months or years of market gains are common when periods of high valuation are accompanied by deteriorating market action. QII sees many quantitative danger signs. Popular media has picked up on some danger signs. For example, corporate insider buying is near a
record low, while advisors, who are often on the wrong side of market moves, recently experienced a
30-year high in optimism.
Yet despite the warning signs and the high valuations, there was a marked absence of volatility during the period. In fact, the first quarter was in
several ways one of the most sanguine stretches in market history:
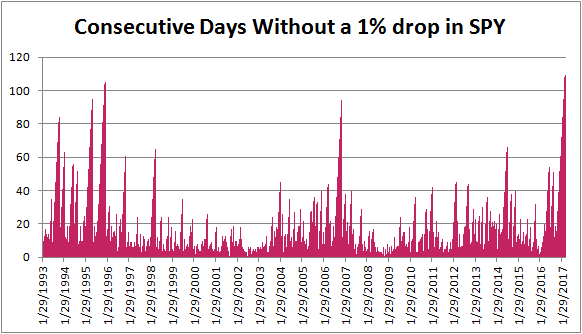
The absence of large falls meant that QII lost a little on every day, without large down days to make up for it. We view this as a temporary accident of market history that we suspect will be reversed in force during the coming quarters.
On the dynamic allocation front, results have been mixed. Clients benefitted from near-maximum allocations to international equities through GRV, which gained 8.2% during the first quarter. However, we’ve continued to underallocate to FV, as US equities appear to be very richly valued, and overallocate to our market neutral strategies. Despite the rich valuation, US equities had a strong quarter (FV +5.8%) and both market neutral strategies struggled (QII -10.1%, QMN -1.6%).
We are confident in our dynamic allocation predictions, but caution clients that these are very long-term investment decisions. We believe the outperformance potential of dynamic allocation is significant, but randomness rules in any particular quarter. Investors and managers
need patience and discipline to reap these rewards. We intend to have clients for life, and this enables us to implement long-term wealth maximization techniques like dynamic allocation where others cannot.
We are grateful for your business and your trust, and a special thank you to those that have referred friends and family. There is no greater compliment.
Below you'll see a chart of the performance of your investments (in red) compared to a relevant benchmark (in gray). Benchmarks are investable assets chosen because they are most comparable to a given strategy.
Many wealth managers don't like to discuss returns, especially in comparison to benchmarks. That's because they are salesmen, not investors, and their track records would prove that. These quarterly performance updates are one way in which we're bringing radical transparency to wealth management. Since we charge fees at the account level, account returns are shown net of fees, while individual strategy returns are shown gross of fees.
We're happy to provide more details and answer any questions. We sincerely thank you for your time and your trust.
- Bireme Capital


