
The World's No. 1 Portfolio Protection Investment
Special Report
By: Dan Ferris
In 2023, stocks are on a tear. Home prices are surging. And unemployment is near record lows.
In short, Americans are richer than ever.
And yet, consumers are starting to struggle.
As the Washington Post recently reported...
More Americans are falling behind on their car loan and credit card payments than at any time in more than a decade, a troubling signal of consumer stress as higher prices and rising borrowing costs are squeezing household budgets.
The pain is most acute for lower-income earners, who have largely used whatever they managed to save during the pandemic with the help of government stimulus checks and breaks on obligations such as rent and student loans.
"The increase in delinquencies and defaults is symptomatic of the tough decisions that these households are having to make right now – whether to pay their credit card bills, their rent or buy groceries," said Mark Zandi, chief economist at Moody's Analytics.
This summer, the U.S. Federal Reserve reported 30-day auto-loan delinquencies at five-year highs and 90-day delinquencies at four-year highs. Delinquencies are when a borrower hasn't paid on time. After several months of nonpayment, the lender gives up and the loan becomes a default. And auto industry analysts at Cox Automotive recently said defaults jumped 74.6% year over year.
It's the same story with credit-card debt... This summer, 30-day credit-card delinquencies came in at 12-year highs and 90-day delinquencies were at three-year highs. Defaults have remained steady... so far.
At 3.8%, unemployment rates are near record lows. And Americans' total net worth recently hit a new all-time high of $154 trillion. Yet delinquencies and, in some cases, defaults of credit-card and auto loans are making new multiyear highs.
If those rates continue to rise, banks and bondholders will wind up with a lot of consumer and business debt that borrowers can't afford to repay. If it gets bad enough, the stock market could scrape new bear market lows faster than most investors would ever expect.
Ultimately, I don't know if these trends will keep going in the wrong direction. But they've already gone far enough to start worrying me.
That's because the auto-loan and credit-card markets are symptoms of a larger concern...
It's looking more and more like we're headed toward a market crash.
Right now, bonds are deep into a three-year bear market. And yet for most of 2023, stocks have acted like there isn't a risk in sight. They've surged off 2022 lows and still trade at mega-bubble valuations.
If the bond market doesn't recover for an extended period, a stock reversal is likely right around the corner.
Instead of sitting on the sidelines, however, we've found a unique investment that pays the safest 5%-plus yield on the planet right now. And if we're right about the direction of the economy, that dividend could rise even further over the next year.
In short, we've got a way for you to profit from uncertainty.
To understand how, let's look at some basic concepts that apply to the stock and bond markets...
The Most Important Price in the World
Modern economies run on debt. When debt markets fail, economies grind to a halt, people lose their jobs, and recessions and depressions ensue.
Since the world economy needs debt to keep running, that means interest rates affect the price of everything. Less ability to borrow in any sector of the global economy will likely mean lower prices for goods and services in that sector.
That's why interest rates are the most important prices in the world. They're the price of money... If interest rates are high, money is expensive, making it more burdensome to buy anything on credit. If rates are low, money is cheap, making it easier to buy on credit.
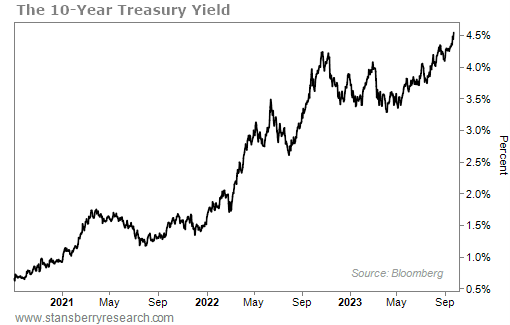
The yield on the U.S. 10-year Treasury note is arguably the most important interest rate of them all. ("Note" is just another word for "bond.") It's a standard benchmark for all kinds of investments.
If you've ever heard someone say a particular interest rate is so many points "over prime," they're referring to the prime rate – the traditional reference point banks use for many types of real estate and consumer loans. (This rate currently sits at 8.5%.) Bankers start there and add points for riskier loans.
Well, the 10-year U.S. Treasury yield is like the prime rate for the whole world... for 10-year government, corporate, and high-yield ("junk") bonds and for loans in every industry on the planet.
Because it's so important, the 10-year Treasury is also a reasonable proxy for the entire bond market.
Interest rates can rise for various reasons. But overall, higher interest rates reflect higher risk. It could be inflation risk, credit risk, or any number of other types of risk, alone or in combination. Just remember: Higher rates equal higher risk.
In 2020, interest rates hit a 5,000-year low. (Sidney Homer and Richard Sylla's landmark book, A History of Interest Rates, traced interest rates back 5,000 years to ancient Sumerian documents.) Although they quickly bounced again, they remained ultralow until early 2022, when the Fed started hiking in an effort to throttle inflation.
So the most important prices in the world have gone from their cheapest level in all of recorded history to the highest level of the past 15 years... And they've risen faster than any time in more than 40 years.
Since rising rates means falling prices for bonds, loans, and any other type of debt, we've seen a bear market in this space for the past three years... and counting.
The 10-year Treasury yield hit a new recent high yesterday, which means the bond market hit a new low. It's now at its highest level since November 2007...
We're deep into a bear market for bonds. That alone is troubling, for reasons I'll get to later in this report. But when you combine it with our stock market outlook, things get even more concerning...
America's Favorite Investment
Instead of thinking about the whole stock market, let's start off by thinking about the general concept of equity.
Whether we're talking about an individual homeowner, small business, or large corporation, equity is simply what you own minus what you owe. If you owe $300,000 on a home worth $400,000, you have $100,000 of home equity.
It's the same with companies. Publicly traded companies are required to file their financial statements with the U.S. Securities and Exchange Commission every three months. This includes a balance sheet that shows their assets, liabilities, and the difference between the two: shareholders' equity. That's why stocks are called "equities."
Equity is Americans' favorite investment – whether it's in their homes, their small businesses, or their stock portfolios.
If you want to get rid of your debts without paying them – the $300,000 remaining on your mortgage, for instance – you'll need to go through a complicated bankruptcy process to prove you can't pay them. However, equity – the $100,000 of your home that you own outright – can disappear without any kind of complex legal process.
If housing prices fall and your house is suddenly only worth $200,000... you still owe the bank $300,000.
Your equity was wiped out. But your debt remains.
That's why debt is generally a safer investment than equity. No matter what the equity in a home or business is worth, the debts are still the same.
For that reason, your money is generally safer in bonds than in stocks.
Even if bond prices fall due to movements in interest rates, borrowers who hold their bonds to maturity will get paid back as long as the issuer can afford it.
So you're far less likely to lose money in the bond market than in the stock market...
Just as a home's equity can disappear, a stock's price can go to zero... or fall so far so fast that it'll feel like it went to zero. And the stock market can be downright perverse, making an investment seem like a slam dunk, only to turn around and generate huge losses.
For example, exercise company Peloton Interactive (PTON) went public for $29 per share in September 2019. Fueled by a pandemic-related sales boost, shares hit $167 in January 2021. Today, they trade for less than $5... a decline of more than 97%.
So here's the situation...
There's a Disconnect Between Stocks and Bonds
The bond market is hitting new lows (and new highs in rates). That reflects growing risks from inflation and increasing government debt burdens.
At the same time, the stock market is acting like everything is just fine, with equities still trading at mega-bubble valuations...
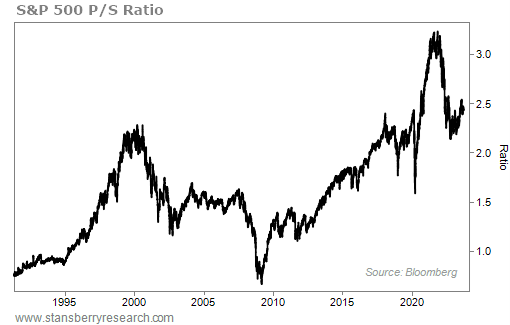
Right now, the S&P 500 Index is trading at a price-to-sales (P/S) ratio – which has an excellent history of indicating when stocks have reached extreme highs – of about 2.4. As you can see on the chart, that's below the all-time high of 3.2 in late 2021 but still above one of the most expensive moments in stock market history: the dot-com peak in 2000, when the S&P 500's P/S ratio hit a high of 2.3...
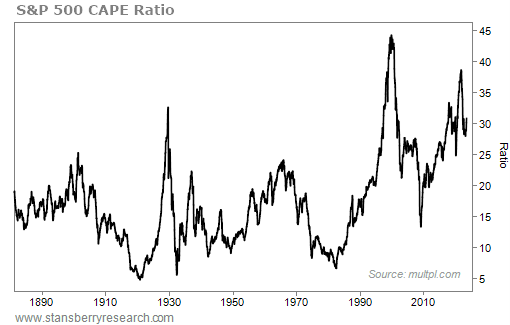
The ratio of S&P 500 stocks to their cyclically adjusted price to earnings ("CAPE") is another excellent way to spot extremely expensive stock prices. This CAPE ratio was proposed by economists John Campbell and Robert Shiller in a 1988 paper as a superior way to measure the historical valuations of public companies. It is particularly good at identifying moments when valuations reach extreme highs.
According to the CAPE ratio, we're still in mega-bubble territory... At about 30, the current ratio is right around its level at the peak of the 1929 mega-bubble – just before the market crashed and ushered in the Great Depression.
The whole situation is backward... We know bonds are the safer place for your money... but that's the market that's making new lows, reflecting growing risks.
And we know stocks are the riskier place for your money... but that's the market that's priced like there's not a risk in sight.
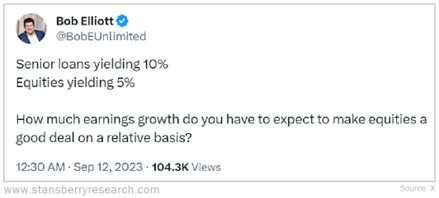
Other analysts I respect see a similar dynamic. On X (formerly known as Twitter), Bob Elliott – the co-founder and CEO of Unlimited Funds – implied earnings will need to grow a lot more relative to bond yields than can be realistically expected to justify the market's current valuation...
Our friend Joel Litman – forensic accounting expert and founder of our corporate affiliate Altimetry – also believes the current market valuation is unjustifiably high. And he's more worried about a market crash than at any time since 2008.
I, too, see this reversed situation partially correcting...
Over the next three to 12 months, the odds favor higher interest rates and lower stock prices.
At this point, you might think my message in this report is to stay away from any kind of bond. I do think inflation will hurt many bond investors over the next few years, but most of the damage will be in bonds with maturities of a few years or more.
Shorter-term bonds could actually earn you multiples on your money as interest rates rise...
My No. 1 No-Brainer Recommendation Right Now
The SPDR Bloomberg 1-3 Month T-Bill Fund (NYSE: BIL) currently holds 18 positions in U.S. Treasury bills maturing in one to three months. (T-bills are the shortest-term obligations of the U.S. government.)
It pays a monthly dividend. The current yield is 5.3%.
You might see a lower number quoted for the current yield on certain websites like Yahoo Finance. That's because these websites calculate current dividends by adding up the past 12 months of dividends and expressing them as a percentage of the current share price.
But that's not how T-bill yields work. They mature in much less than a year, so the fund's current holdings are different than its holdings three months ago (let alone a whole year ago!) and will change in the next three months.
The correct way to calculate the current yield is to take the latest monthly dividend payment ($0.405 per share), multiply it by 12 ($4.86), and express that as a percentage of the most recent share price ($91.75). The result is a current yield of 5.3%. That's the annualized yield of BIL right now.
If interest rates rise somewhat over the next year, you'll earn more than 5.3% on your money over the next 12 months, possibly even as much as 6%.
At 5.3% compounded, you'll safely double your money in a little less than 14 years. In fact, this is absolutely the safest 5%-plus yield on the planet right now. Let me explain why...
Risk is the range of potential outcomes. High risk means a wide range of potential outcomes. Low risk means a narrow range of potential outcomes.
If you buy a risky little mining-exploration stock or biotech stock, you could make 100 times your money or you could lose every penny of it.
If you buy the S&P 500, you could make a decent annualized return over the long term, but you'll have to risk it going sideways for a long time or down a lot in the short term.
If you leave your money in cash, it won't rise or fall much in nominal value (though inflation will likely hurt it over the long term).
BIL has generated a very narrow range of outcomes over the life of the fund so far...
Since the fund's inception on May 25, 2007, the closing share price has been as high as $92.48 and as low as $91.34 – a total fluctuation of about 1.2% over a 16-year period. That's despite a huge fluctuation in yields. During that period, three-month T-bill yields have been as low as 0.05% and as high as 5.35%.
The price didn't change much even when the yield changed a lot because these are very short-term obligations. The yields are quoted at annualized rates, but the longest-term bills in the fund mature in just 91 days. The average maturity of the fund's T-bills is reported as 0.1 years, which translates to about 37 days.
T-bill values remain stable because everybody knows the federal government will repay its short-term debts, even when the headlines are filled with debt-ceiling debates and looming government shutdowns. Longer-term bonds fluctuate much more widely in price because there's more risk and uncertainty over a longer period.
Nobody can predict the future, but the odds are strongly in your favor when you're only lending the government your money for a maximum of 91 days.
We're all confident the government will pay its bills three months from now. We're less confident about 20 or 30 years from now. You can see that in the price action of the iShares 20+ Year Treasury Bond Fund (TLT)...
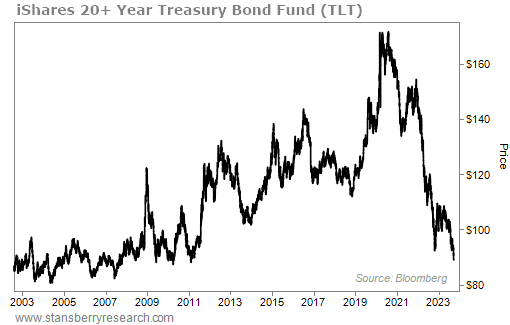
Since its inception on July 22, 2002, its highest closing price of $171.57 is roughly 113% higher than its lowest closing price of $80.65. That's a wide range of outcomes, indicating higher risk.
If you want to prepare for a market crash while taking on the least possible risk and earning the highest possible yield, I recommend you...
Buy the SPDR Bloomberg 1-3 Month T-Bill Fund (NYSE: BIL).
Your Income Can Even Rise in a Market Crash
In September, the Federal Open Market Committee voted to keep its benchmark fed-funds interest rate unchanged. The target range is still 5.25% to 5.5%.
Fed Chair Jerome Powell indicated in a press conference afterward that the Fed will likely hike rates one more time in 2023 and keep rates higher for longer than most analysts expect. That means the SPDR Bloomberg 1-3 Month T-Bill Fund could see some dividend growth through 2024.
It also means that the longer rates stay higher – even if it's only for another six months or so – the more likely stock market valuations will fall out of mega-bubble territory...
T-bills yielding more than 5% compete with stocks. If you know you can get a safe 5% return, that creates a hurdle that stocks have to jump over to attract capital.
That's a very different scenario than when the Fed held rates near zero for most of the period from 2008 through 2022. When rates are at or near zero, it's impossible for savers to get any meaningful amount of safe yield on their money.
So they use some or all of their savings to take on more risk in the stock market. Low rates naturally raise investors' risk tolerance and help push stock prices into mega-bubble territory.
Rates above 5% on risk-free T-bills, however, lower investors' risk tolerance. When they have an alternative place to put their money, they're more likely to be skeptical of the lofty visions and big promises they've been listening to for more than a decade... most of which turned out to be duds and obliterated investor capital in the 2022 market rout.
The longer the Fed remains hawkish (inclined to raise interest rates), the more likely it is we'll see a downtrend in stocks.
Potentially even a serious crash...
What About the Rest of Your Portfolio?
There's a common theme when you look back at the biggest financial calamities in America... 1907... 1929... 1982... 1998... 2007...
They can all be traced back to the exact same place.
You see, each one began because of what's known as "shadow banks."
Shadow banks are the institutions operating on the periphery... or "in the shadows of" regular banks.
However, these banks are regulated like ordinary banks and are a lot less likely to be bailed out by the government. That means there's no Federal Deposit Insurance Corporation ("FDIC") insurance. And they're typically creating riskier financial instruments while avoiding regular banks' capital requirements.
We're talking about hedge funds, private-equity firms, investment trusts, business-development corporations, mortgage lenders, insurance companies, and money-market firms.
When you study economic history, you find that the shadow banking system is ALWAYS where the biggest disasters start.
Today's financial disaster, like all the others, followed the same exact script...
- Massively inflated assets and rising interest rates provided fuel.
- A spark from a highly unregulated shadow banking sector lit the fire.
The situation today is much worse than it was in 2008 though, because low rates pushed so much money into the shadow banking system as people chased higher yields.
Shadow banks now make up roughly HALF of all the world's financial assets.
A conservative estimate for the problems in shadow banking would be to think that the issues are at least twice as bad as the regular banking system.
There could easily be at least $1 trillion in unrealized losses and new interest-rate expenses in shadow banks today.
We can expect to see several financial catastrophes over the next two years.
The "private debt" market is one part of the shadow banking system just waiting to detonate.
Private debt refers to money lent or borrowed by privately held companies. It usually involves non-bank institutions (shadow banks) making loans to private companies or buying those loans on the secondary market.
Private debt is the riskiest of the risky debt out there today.
But private debt isn't the only disaster of this crisis...
There are trillions of dollars tied up in places you've probably never even heard about. And the money is collapsing before our eyes.
It's going to be bad... really bad... for millions of people over the next few years.
But it doesn't have to be bad for you.
Watch our new presentation to find out the few, but critical, steps my team and I strongly recommend.