The 2022 Stock Market Survival Guide
Brought to you by Stansberry Research, the leading independent publisher of trusted financial information
Introduction
I'm sure you've noticed that prices for almost everything are absolutely soaring.
At Stansberry Research, we've helped investors grow their wealth for more than 20 years, both by sharing specific investment recommendations and by educating our readers.
We've also always had a keen eye on the practice of preserving and protecting your money.
After all, you've worked hard to build your savings, and losses now mean you can't compound the growth on that wealth for the future.
By remaining clearheaded about the risks in the market, we've thrived as an independent research firm. We've grown through two decades that contained the dot-com bubble, the financial crisis, and the pandemic crash.
In this exclusive report, we want to show you how to do the same...
We'll share specific investments you can make today to keep your portfolio protected. Each one of which could protect your savings and give you relative safety and stability amid the whiplash of war... inflation... and the rumblings of a devastating bear market ahead...
In this report – excerpted from our full Stansberry Research Financial Survival Program, which others have paid upward of $299 – you'll find research from analysts and editors across our entire publishing firm... to give you a full picture of what kind of investments keep you safe. Reducing your downside even a little can help you sleep well at night and perform better as an investor.
We don't think you ever need to fear markets – you just need to prepare for what they may do.
Regards,
Matt Weinschenk
Director of Research, Stansberry Research
Ready or Not, the Bear Market Is Coming
You always need protection for a bear market.
Since 1940 there have been 17 bear markets with an average loss of around 22%. That's applying this definition from Ned Davis Research to the S&P 500 Index...
A bear market requires a 30% drop in the Dow Jones Industrial Average after 50 calendar days or a 13% decline after 145 calendar days. Reversals of 30% in the Value Line Geometric Index also qualify.
In other words, when a market drops far and fast – or has a lesser, sustained decline – then it's a bear market.
And while not all bear markets look the same, they have one thing in common... They cause pain for most investors.
These kinds of drops can be devastating to your portfolio.
So let's take a look at why some of the biggest crashes in recent history happened... and how they tend to play out...
The Anatomy of a Bear Market
Today, there is one simple thing that every single American should do with their cash...
Bear markets happen for a lot of different reasons. They each differ in why stocks decline for an extended period. But when you break it down, they also have a lot in common...
There are four "phases" of a bear market that you need to be aware of:
- Initial Decline – This sets in after a big run higher in stocks. It catches most off guard.
- Relief Rally – This sets in motion a psychological state for most investors that phase one, the initial decline, was just a correction, and the worst is behind us.
- Panic – This is the worst phase of the bear market. Every sector of the stock market suffers large declines.
- Bottom – This phase is marked with capitulation from most investors, extreme pessimism, and a general consensus that the future is bleak.
Let's look at the Dow Jones Industrial Average back in 1929 to give a perfect example of the phases of a bear market...
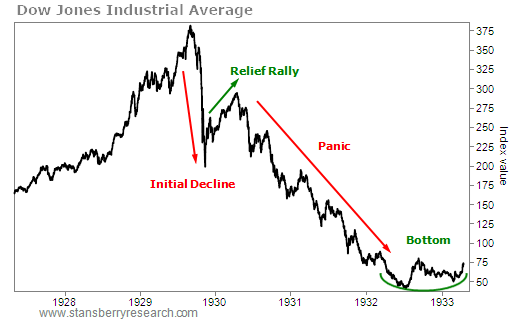
The pattern is quite clear – an initial (very large) decline, followed by a strong relief rally, a panic that lasted more than two years, and finally, a bottom.
This bear market began with extreme speculation in the stock market, a credit crisis, and ultimately the Great Depression.
From the 1929 high to the 1932 low, the Dow Jones Industrial Average fell 89%.
Jumping forward in time, the dot-com crisis of 2000 began with a bubble in technology stocks. And looking at the chart below, you can see how the phases played out in the Nasdaq 100 Index too...
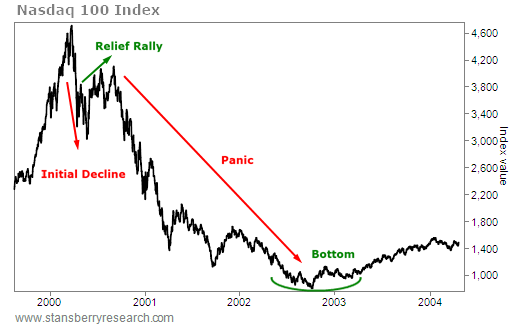
I'll repeat: different causes for the bear market, but the exact same phases of a bear market.
From the 2000 high to the 2002 low, the Nasdaq 100 fell 82%.
And here is the S&P 500 Index back in 2007 to 2009. A crisis in the banking sector regarding bad loans in the housing sector led to a 56% decline from the 2007 high to the 2009 low...
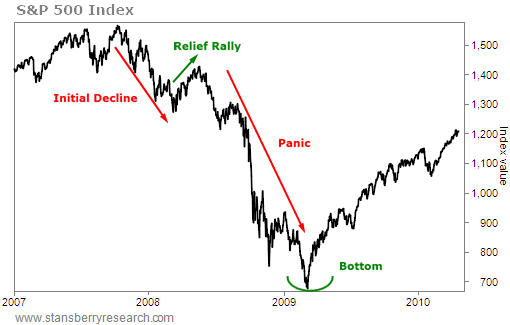
The same four phases repeated in this bear market. It was a different "why," but the same result.
So as history repeats, the "why" may change, but the characteristics of a bear market do NOT.
In each one of these examples, the bear market lasted about two years with all of them more than half their value.
Don't think it can't happen again...
Right now, the Nasdaq 100 is down 22%, and falling... So that begs the question... where are we now within the phases of a bear market?
Let's take a look at the Nasdaq Index again (but any market still fits within the bear market "phases")...
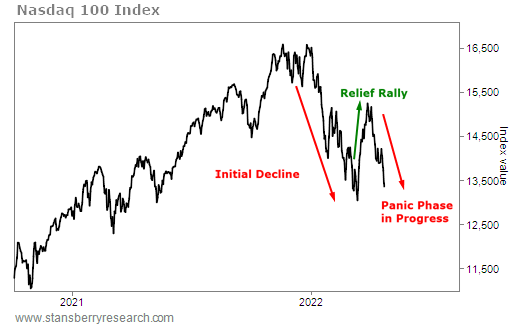
The initial decline from the start of the year is clear, as was the relief rally into late March. The steep decline since likely means we are entering the "panic" phase of this bear market. And the decline is going to get much worse...
The price action so far is following the exact same path of the three previous big bear markets. So unless this changes, we are here in phase three right now...
The crash is happening as you read this.
Though keep in mind, we can't know the future. So you always need to be aware of when you are wrong.
From the chart above, only a move above late March's highs would tell us that this is no longer a bear market. We don't see that as a high probability, but it's something you need to consider.
So if every bear market doesn't commence for the same reason or catalyst, what is this bear market made of and which stocks will suffer as a result?
The answer to the "why" of this bear market is inflation.
It's at multidecade highs. It's a problem for you, a problem for businesses, and most importantly it's a problem for the Federal Reserve.
You see for many years, the Fed "had your back" as an investor after crises or periods of volatility during which it could print more money, buy bonds to keep interest rates low or a combination of the two.
It can't do that anymore.
Because of its easy-money policies, the chickens are coming home to roost – especially after all the eye-popping COVID-19 stimulus.
The Fed has to fight inflation for the sake of growth and asset prices – which means the stock market is going to suffer. It's going to reduce bond purchases and increase interest rates at a rate faster than it has in decades. It has no choice.
Comparisons of years past where the Fed has hiked interest rates aren't even in the same ballpark as the current environment. The rate of inflation is much, much higher now than any time in the past 40 years and during any previous hiking cycle.
Which leads us to...
How To Handle Volatility in 2022
We are at the beginning of a complete transformation of our financial system... the beginning of a New Inflationary Era.
Most Americans have never experienced this type of inflationary environment – nearly half the U.S. Population was born AFTER 1981. They don't understand how the U.S. Treasury and the Federal Reserve are purposefully devaluing our money in a way we've never seen before.
In times of crisis, you can bet on one sure thing... volatility.
That's why the primary goal as an investor is to stay in the game. You need to survive. And to do that, you need to make sure that you've positioned yourself for both good times and bad.
Since the vast majority of individuals trying to build and protect their wealth count on stocks to deliver returns, we need to understand just how risky stocks can be and what we can do to avoid and protect ourselves from a bear market.
Investing has one requirement and one extraordinary benefit...
First, you need to have capital to play. And second, you can earn compounding rates of return on that capital.
That makes volatility a killer...
If you haven't positioned properly, a bear market can wipe you out. You worked hard for the wealth you've invested. If it goes to zero, you can't easily build it back.
But even if you take a smaller hit, you can lose big. Since every dollar of wealth has the opportunity to compound, a loss today penalizes you an outsized amount down the line.
This is why it is so important to always have bear-market protection and how reducing your volatility can improve your investment returns.
How Important is Volatility?
Warren Buffet likes to distill investing in the following way:
Rule No. 1: Never lose money
Rule No. 2: Never forget rule No. 1
Losing money hurts you more than you think.
Here's a thought. Take two portfolios that each return 10% a year on average. The first has a volatility of 10%, the second a volatility of 20%. (By volatility, we mean how much the portfolios tend to fluctuate – specifically, it's the standard deviation of returns. A portfolio that has bigger swings up and down has higher volatility, even if it has the same return.)
Most investors would look at this and say that a lower-volatility portfolio is nice... but so long as it returns the same amount and you can hold for the long term, these two portfolios look the same when it all shakes out.
In reality, the lower-volatility portfolio generates a higher return over time and a higher level of wealth despite the fact that they have the same average annual returns.
Since returns compound over time, that means your wealth grows at what's called the geometric average return, not necessarily the "average annual return of 10%."
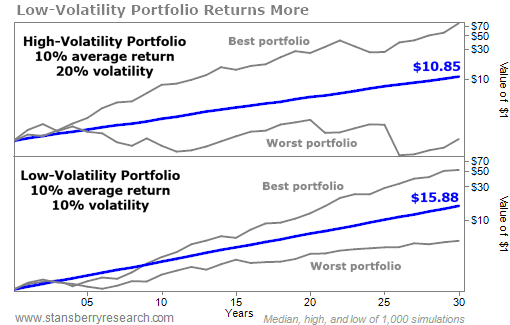
As the charts show, both the top and bottom portfolios have an average return of 10%, but the less volatile one on the bottom shows a better return. Clearly the range of outcomes for the top, more volatile portfolio is wider... But you are likely to earn a better compounding annual return in the portfolio with lower volatility at 9.6% per year compared with 8.2% for the high-volatility portfolio. And over the years, that's a huge difference.
Again, that's with the same average annual return.
This is sometimes known as volatility drag. It stems from the fact that you don't actually experience an average return. You experience one return, each year, and they compound through time. If the volatility is higher in a portfolio, you can earn less than the average annual return (that's the drag). And that's because when the volatile portfolio falls, it takes that much more to return it back to where it was.
The key feature here is that losses hurt you more than gains give you benefit.
Remember, if you experience a 30% loss, you need a 42% gain to get back to even. If you take a 50% loss, you need a 100% gain.
If you have a portfolio chugging along at, say, 10% a year, and the portfolio takes a hit, it takes years just to get back to even.
How to Protect Your Wealth
Since the vast majority of individuals trying to build and protect their wealth count on stocks to deliver returns, we need to understand just how risky stocks can be and what we can do to avoid and protect ourselves from a bear market.
First, markets climb slowly and for a long time, then correct quickly. The bad times last about one-quarter of the duration of the good times.
Central to our thesis of financial survival is that you shouldn't attempt to predict specific turns in the market. Few, if any, have the ability to predict markets in such a way consistently.
Instead, you should carefully prepare yourself for whatever may come to reduce your risk of loss.
Still, there are times when stocks stand on shaky footing – and you should be attuned to when risks are greater.
In this vein, there's a simple yet effective indicator in the yield curve.
This is an esoteric financial concept that you never hear about except when its value gets low and financial media need to gin up a headline. And you've likely never seen a full breakdown in order to judge its predictive power on its own.
The yield curve is the difference between the yields on fixed-income securities maturing at different times. You can use any maturity dates you'd like, though a couple have emerged to be the standard benchmark. The most common is the difference between 2-year notes and 10-year bonds.
Normally, shorter-dated notes have lower yields than longer-dated bonds. That's called a "positively shaped yield curve." The future 10 years from now is always more uncertain than two years from now, so you're supposed to get a higher yield when you buy longer bonds to account for that risk.
Over the history of interest rates, sometimes this relationship doesn't hold and the yield curve "inverts." That's where shorter-term notes pay better yields than long-term bonds. This happens when investors expect lower interest rates, lower inflation, or even deflation in the future. These things will normally happen only if the economy gets bad.
So, does the yield curve predict bear markets?
When it inverts, it's surely not a good sign. If the curve inverts and lasts for at least a couple weeks, a bear market tends to come in the next few months. A recession follows a few months after that.
At the same time, we have to recognize we are in a unique time for monetary policy. The Federal Reserve over the past few years has been raising short-term rates. That could make an inverted yield curve a weaker signal than it has been in the past.
You don't have to bear the full brunt of bear markets. Certain assets perform well even when the market is falling. If you are staying in the stock market, certain sectors can offer protection.
Utilities, consumer staples, and health care stocks offer opportunities to safeguard your wealth.
Whereas financial and technology stocks are often hit the hardest.
How Fast is This Bear Market Approaching?
While there are many similarities between the inflation unfolding today and what happened in America in the 1970s, the inflationary script for the next few years in America will look quite different than it has in the past.
We are on a dangerous path in America. Our government has set us on the road to currency devaluation and a new era of inflation.
Some assets are going to suffer, big time. Others will skyrocket in value. The wealth gap will get wider than ever before. But you can potentially grow and protect your wealth in the years to come.
Sadly, this crisis is all going to tear our country apart over the next few years...
On one side will be those who understand what's happening, who take the necessary steps. These folks will continue to get richer and richer.
On the other side... well... unfortunately, that's most Americans... who won't understand what's going on... and will cling to a collapsing currency, falling further and further behind.
For yourself, and your family, get the facts. Learn how to take advantage of this trend so you are not left behind.
There's no doubt we're in for huge changes to our financial system in the next few years.
If you are counting on IRAs, 401(k)s, insurance policies, annuities, pension plans, stocks, or bonds, this information is critical.
I believe we'll have an extraordinary retirement crisis, and programs retirees are counting on today (such as IRAs, 401(k)s, insurance policies, annuities, pension plans, etc.) collapse in REAL value.
Consider this your final wake-up call...
Billionaires including Warren Buffett, Stanley Druckenmiller, Paul Tudor-Jones, Bill Ackman, and more have stated publicly that Americans aren't paying enough attention to this development.
That's why I have gone public with what I believe is the most important and useful analysis on this situation in the financial world today. You can access my latest analysis by clicking right here.
The Next Commodity Supercycle Begins Now
Many of the largest fortunes ever made or lost came from speculating on commodity prices.
Professional traders betting on rising or falling futures contracts can make a killing... or get wiped out in a matter of weeks or days.
But since the Great Recession of 2008, the commodity sector hasn't had much to cheer about.
Things got so bad that major investment banks began closing their commodities trading desks.
As contrarians, we love to buy sectors that are hated by mainstream investors. Since 2008, we've waited with anticipation for the market conditions to change. As the saying goes... the cure for low prices is low prices. And commodities have been historically cheap for years. Yet every time it looked like commodities were about to break out, they came crashing back down.
But finally, the setup we've been waiting for is here. And luckily, we don't need to make risky bets on futures contracts to profit.
Commodities are simply the basic goods and materials that society needs to function and thrive – such as wheat, coffee, copper, oil, and livestock. Investing in commodities isn't as "sexy" as buying the latest tech fad, but under the right circumstances, these can be incredible investments.
History of Supercycles
Commodity prices tend to move as a group through long markets (bull or bear) called "supercycles."
The following table shows the major commodity supercycles dating back more than 200 years.
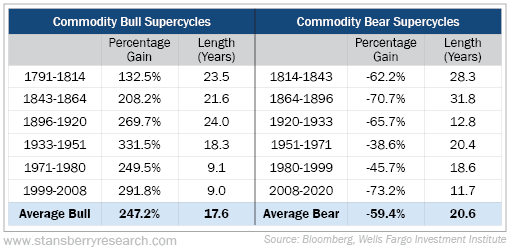
As you can see, the average bull market in commodities lasts around 17 years and gains around 250%.
Of course, commodities often have their own individual cycles. But supercycles occur when all or most of them move together.
The last bull cycle came in the early 2000s. And after more than a decade in a bear market, all signs are pointing to commodities breaking out on a multiyear run higher.
These bull cycles are typically set off by some sort of catalyst that causes a shock in supply or demand – such as war. The last bull cycle was spurred by Chinese demand as the nation aggressively built out its infrastructure.
This time around, we have several catalysts. But first, let's set the stage.
Breakdown in the Supply Chain
As commodities languished over the past decade, companies were faced with financial challenges. Some paid too much for assets at the peak of the last cycle and spent years writing them down and repairing their balance sheets.
Capital expenditures for new equipment and processing facilities were put on hold. Miners held off on exploration spending and permitting efforts on new mines. As a result, inventories and resource reserves fell.
To make matters worse, investors all but left the sector for dead.
Then, in the spring of 2020, the COVID-19 pandemic swept across the globe. Factories, schools, businesses, and transportation came to a grinding halt as government-imposed restrictions forced people to stay home in an effort to control the spread
.By the summer of 2020, China – which had been the first country to mandate a lockdown – began ramping back up its manufacturing plants.
With most of the world still paralyzed by COVID-19, China took advantage of low prices and began gobbling up commodities. And as the rest of the world came back to life, demand – and prices – began to soar.
Commodity producers were caught off guard as demand soared. After all, they had been suffering low prices for more than a decade.
But there was another problem.
Prior to the pandemic, the global economy operated on a finely tuned network of supply chains. But as countries closed their borders, supply chains fell into disarray. Even as folks began going back to work, on the national level, many borders remained closed.
This prevented raw materials and finished goods from getting to their destinations. We all remember seeing empty shelves at the grocery store and waiting until March 2021 for Christmas gifts to arrive. Cargo ships were stranded in ports for months, waiting to unload.
Many of these supply chains are still out of whack. And they may never return to their pre-pandemic forms. Many countries are searching for ways to produce more goods within their borders to avoid the need to rely on foreign countries.
That brings us to the next catalyst... inflation.
Monetary Policy and Runaway Inflation
Supply-chain disruptions certainly lit the match that led to higher prices, but reckless monetary policies by the Federal Reserve and Congress poured gasoline on the fire.
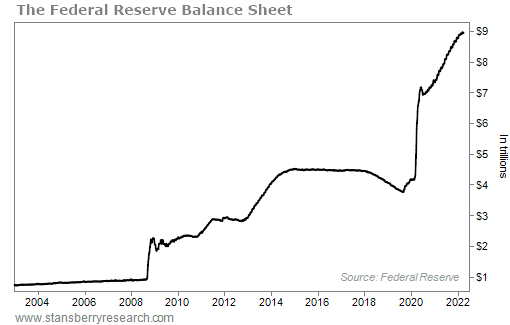
When the pandemic arrived, the Fed didn't waste any time. It immediately slashed interest rates to zero. Then, it began purchasing U.S. Treasuries and mortgage-backed securities in earnest as it increased its balance sheet from $4 trillion to nearly $9 trillion. In only two years, the Fed increased the money supply by a ludicrous 40%.
Meanwhile, Congress was on its own spending spree – passing bills that added about $4.5 trillion for COVID-19 relief.
This money-printing causes the purchasing power of the dollar to fall. There is just too much money chasing too few goods.
And this all came at a time when most folks weren't spending a whole lot of money. They were dining in, foregoing vacations, and avoiding events with large gatherings.
After saying for months that inflation was "transitory," the Fed was forced to acknowledge that inflation was running hotter than expected. Currently, it's around 40-year highs.
And we don't expect inflation to end anytime soon. The Fed has begun to tighten its policies... but it's in a tough spot. If it raises rates too fast, it could spark a recession as debt becomes unmanageable for many companies.
It recently hiked rates for the first time since 2018... by a paltry 0.25%. Despite plans for more increases this year, we doubt this will be enough to get inflation under control.
It might come down a bit, but our guess is that it will remain significantly high for at least a year.
During a prolonged inflationary period, investors tend to put their money into "hard assets" like gold, real estate, and commodities. These are tangible assets with fundamental values. They're unlikely to go to zero even under the worst economic conditions.
You might be thinking to yourself... "Well, gee, everyday commodities like gasoline, groceries, and housing are all up significantly over the past two years. Did I miss the boat?"
The answer is no... not even close.
The following chart shows the price ratio between the S&P GSCI Total Return Index – a benchmark of global commodity performance – and the S&P 500 Index.
As the ratio falls, commodities are considered cheap compared with stocks. And as you can see, this ratio has been stuck at 50-year lows.
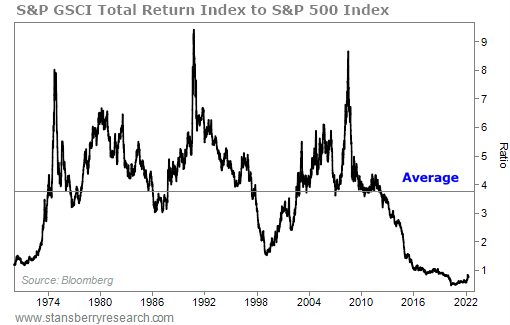
And that's impressive, considering that the price of most commodities soared last year. For example, the Bloomberg Commodity Spot Index – which tracks a basket of 23 energy, metal, and agriculture futures – rose 27% for the year. That's the largest gain since 2009, as the world recovered from the financial crisis.
Even with last year's great performance, commodities barely made any ground on stocks.
Earlier, we mentioned that the average upside potential for commodities in a bull supercycle is around 250%.
But that doesn't tell the whole story...
The companies that produce and sell commodities can soar several times higher.
You see, these companies offer leverage to rising prices. Most commodity producers have relatively fixed costs. So for example, as the price of gold soars higher and higher, gold miners can generate gobs of cash because the higher sales prices go straight to their bottom line.
Plus, large commodity producers own and operate some of the biggest and most important hard assets on the planet. These assets – such as mines, oil fields, or land – can often produce for several decades.
We call this kind of asset a "trophy asset." In short, a trophy asset is one that other companies can't easily recreate or copy, making them virtually irreplaceable.
These are the types of assets we want to own when we invest in commodities. This brings us to the reason that it's now the perfect time to look to gold.
The Beginning of a Gold Run
Throughout history, gold has been the most secure, least volatile, most international, and least political form of money. It continues to offer the same utility today. And it won't take long for gold to climb much, much higher...
The most important thing to realize about gold is that it's the only real money. By that, I mean it's the only currency that isn't someone else's liability. It stands on its own.
Gold has been used as a medium of exchange for more than 5,000 years. Meanwhile, every single fiat (paper) currency in the history of the world has failed. Governments simply cannot resist printing more and more of it until it becomes so watered down that it's worthless.
But governments can't print gold. That's why they hate it as a form of currency. Gold's value comes from its scarcity. And it takes an intense amount of capital, labor, and time to dig it out of the ground and process it.
Historically, during times of financial crisis or political uncertainty, gold has proven its value as a "safe haven" asset. That's why today – perhaps more than ever – it's critical that your portfolio has some exposure to gold.
The economic fallout from the COVID-19 pandemic and ensuing lockdowns is incalculable. And the Federal Reserve and the U.S. government did everything they could to prop up the markets. That means the printing presses ran hot.
The Fed pumped trillions into the markets, on top of the multitrillion stimulus package from Congress.
Of course, none of this money was real. It wasn't earned... It was created.
That doesn't bode well for the value of the dollar. But it will be great for gold. That's why it's more important than ever to place a portion of your investment portfolio in gold... and soon.
How to Buy Gold
There are essentially two ways to invest in gold...
The first is simply buying physical gold. By that, I mean gold bullion and gold coins.
This is the ultimate form of crisis insurance. Gold is a way to store your wealth and preserve your purchasing power. If we do experience a complete economic collapse, gold will still serve as a medium of exchange.
Nobody likes to pay for insurance. We don't ever expect our houses to burn down. But we buy fire insurance just in case... and hope that we'll never need to use it. Physical gold works the same way.
Try to buy a small amount of physical gold (and silver) each year and stow it someplace safe. Then forget about it.
The other primary way to invest in gold is to buy gold stocks. This could be gold miners, precious metals streaming and royalty companies, or various gold-stock exchange-traded funds ("ETFs").
During a bull market in precious metals like the one we're in now, gold stocks can rise much higher and faster than the spot price of the metal. As the price of gold rises, the extra revenue goes straight to the company's bottom line. So it gives an investor leverage to the price of gold.
My favorite way to own gold stocks is through streaming and royalty companies. These companies have a fantastic business model... You see, mining is an extremely risky business. It requires a ton of capital upfront and miners are at the mercy of cyclical price fluctuations. That makes banks leery of lending them money.
That's where streaming and royalty companies come in. They simply lend the miner money in exchange for a portion of future profits. A royalty is simply a small percentage (usually 1% to 3%) of overall sales. A stream is the option to purchase silver and gold produced at the mine for a deep discount from the spot price (as much as 75%). Streams are typical in mines where silver and gold are byproducts of base metal mining.
The best part is, after the initial capital is spent, these companies are done. They just sit back and collect checks for decades. That makes them very low risk. Streaming and royalty companies often perform well, even during bear markets in precious metals. That makes them a great long-term hedge for your portfolio.
Buying gold miner stocks takes a little bit more homework. But they can produce incredible gains during a bull market.
So where does gold go from here?
The Real Price of Gold
As a personal rule, I rarely make bold predictions on a price target for gold. But I am confident that the price of gold will reach $3,000 over the next 12 to 18 months. Here's why...
When we look at gold prices across history, we typically use the "nominal" price. That's simply the number of U.S. dollars it would take to purchase an ounce of gold at that specific point in time.
But we also know that the purchasing power of the dollar has been inflated away over time. A dollar today doesn't purchase what a dollar could buy decades ago.
Meanwhile, the purchasing power of gold has remained relatively constant. For example, throughout the last several hundred years, the price of a custom-tailored men's suit could be purchased for about an ounce of gold.
That's why I prefer to look at gold by using the real price. That means using inflation-adjusted dollars (today's dollars) to value gold through history.
So for example, in 1980 the nominal price of gold was $800 per ounce. But in today's inflation-adjusted dollars, the price would be $2,800 per ounce. That means that gold still hasn't hit its all-time high in real terms. It still needs to climb quite a bit.
And it's going to...
The No. 1 Gold Stock to Buy in 2022
Right now, the conditions are in place for a historic move I expect will be the greatest precious metals bull market in the last 100 years.
The evidence is everywhere...
- Market volatility is rising, with stocks off to the worst start since 2009.
- Inflation at its highest level in 40 years.
- Economic and political pressures are reaching a boiling point.
- Not to mention, nearly every country is devaluing their currencies, one by one, with money printing. Engaging in what looks like a disastrous race to the bottom.
As the rally in gold gains steam, most folks will likely run out and buy bullion or mining stocks.
But I have an unfortunate truth to tell you...
When it comes to investing in gold, most folks will likely miss out on the biggest gains.
That's because there's a much, much better way to profit from the emerging gold boom.
Unfortunately, most people know nothing about it.
As I'll show you, if you follow this simple approach, which has nothing to do with bullion, ETFs, or mining stocks, the gains can be absolutely incredible.
During one period, for example, this virtually unknown gold strategy returned 38% per year!
And not just for a year or two...
This incredible investment returned an average of 38% a year – for 18 straight years...
Turning every $1,000 invested into more than $300,000...
And every $5,000 into a nest-egg of $1.6 million.
In short, the investment I'm about to show you may be one of the world's most profitable and low-risk investments – yet it's still virtually unknown.
And anyone can use it. It's as simple as buying a stock in your ordinary brokerage account.
If you plan to buy gold today, you owe it to yourself to find out more about this little-known opportunity. To discover my No. 1 gold play for 2022, take a look at my research presentation. Inside you'll also learn:
- How to recognize the start of a gold bull market
- What it will take for gold and gold stocks to take off this yea r
- The easiest way to invest in gold
How Bitcoin Can Protect Your Portfolio
The 300,000 folks who call Anchorage, Alaska home have to be prepared for "what ifs" that lower-longitude residents don't often encounter.
Even on an unremarkable day in November, they'd want to be prepared for possible heavy snow... power outages... food shortages... even earthquakes.
You see, in 1964, Anchorage suffered a massive earthquake that took the lives of more than 100 people and caused hundreds of millions of dollars in property damage (roughly equal to $3 billion today).
Because of the extensive damage and lives lost, the city implemented strict building codes to prepare should another disaster strike again. The city built mostly shorter buildings thought to be able to withstand a similar seismic event.
And on November 30, 2018 – 54 years after the first disaster – those codes were put to the test...
A major 7.1 earthquake struck – its epicenter was just 10 miles from the city.
By the next day, it was clear that the damage was tremendous in some places. Remarkably, however, one building survived with so little damage that within 24 hours of the quake, it opened to serve as the emergency community shelter for the entire city of Anchorage.
The Yeadon Dome, while serving perfectly well as a sports arena, likely survived with virtually no damage because it was built completely differently from the buildings that did collapse
.For one thing, Yeadon Domes are inflatable. Instead of traditional brick and mortar or plywood and drywall, these domes are created with the intention of being flexible. They cost less to maintain, and their whole purpose is to be versatile. And therefore, this uniquely built building was able to withstand the disaster.
And when you're looking to prepare and diversify your portfolio or your wealth for the possibility of future damage, you want to look for assets that are built differently, too...
Like Anchorage's Yeadon Dome in the days before the earthquake, you would want to know you had done everything you could to prepare for a crisis. You'd be confident in your assets, even if the event you were preparing for hadn't yet happened and there was no guarantee that it even would happen.
Think about it – when you saw the picture above and realized most of the building structure was neither "sticks nor bricks"... did you think, "Of course it survived!"? And wouldn't you want that "of course it survived!" mentality for your money?
We believe bitcoin – which is clearly built differently from any other investable asset you may have – holds those same properties.
You see, most people think of bitcoin merely as the best-performing asset of the past decade, with even the skeptical Bloomberg noting its 9,000,000% 10-year return.
But more than that, bitcoin stores value on its own network (currently the strongest network ever built)... allows peer-to-peer transactions with no middleman, gatekeeper, or broker... is cryptographically secured against fraudulent transactions... and would be impossible for a government to confiscate when it needs money because asset prices are crashing.
Don't get us wrong... We're not saying bitcoin's price won't dip if everything is crashing. After all, in the short term, its correlation with risky stocks is high.
But over the long term, the correlations diverge...
But perhaps bitcoin's legendary price performance is due to a growing number of people who want at least part of their money to survive any "what if" that comes their way. Indeed, many people buy bitcoin simply because they want to own something they know will still be standing – whatever the price – after the next financial earthquake.
Built to Survive a Financial Crisis
Bitcoin is a form of digital money that runs on independent computers all around the world called the blockchain. A blockchain is essentially a database secured by cryptography and maintained by a network of computers. It's not controlled by any one person, organization, or government... and its monetary policy is set by computer code.
Contrast that with the dollar. What exactly is the dollar's monetary policy? It's a small committee of bankers who lick their fingers and lift them in the air to gauge the markets. If things feel a little breezy, they crank up the money printer. If the wind's blowing a different direction, maybe they slow the printer down.
The only thing they never do is stop the printer altogether. We live in a world where the dominant currency is engineered to bleed value.
That runs counter to the fundamental purpose of a currency. In the big picture, the fundamental purpose of a currency is a way to value something over long periods of time.
Now, fiat currencies like the U.S. dollar aren't fundamentally flawed.
But the U.S. dollar and other fiat currencies are controlled by politically influenced central bankers. That corrupts the value of the currency. It becomes a political issue. And there's political pressure to print more.
The U.S. dollar has lost 95% of its value since 1913. And it has lost 60% of its value since 1984. But the amount of money created since 2008 makes the devaluation in previous decades look insignificant.
Take a look for yourself...
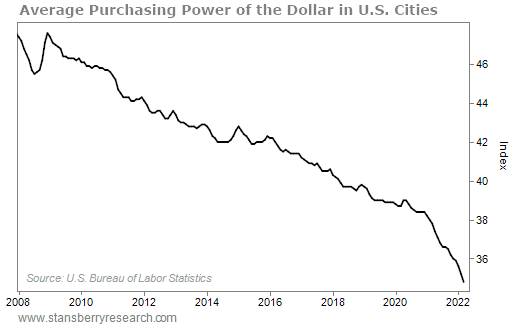
Since 2008, the purchasing power of the dollar has plummeted by more than 23%.
And the Federal Reserve keeps printing money, seemingly with no end in sight.
Take a look at the assets of the Federal Reserve. They've doubled since 2019...
That's where bitcoin comes in.
It takes control over the money supply out of the hands of a cabal of politically influenced bankers and entrusts it to the inalienable laws of mathematics.
Bitcoin can't be stretched, watered down, or manipulated. Bitcoin is transparent, predictable, divisible, and unstoppable.
Anyone anywhere in the world can download some software and set his computer up to start processing bitcoin transactions. Thousands of computers in more than 100 countries are doing that today. As long as just one of them is up and running, bitcoin can be used to make payments.
Those computers have one very important trait, too: They're beyond the reach of central banks. They run computer code that can't be manipulated. As we print our way toward devastating inflation, bitcoin's iron-clad monetary policy will look more and more appealing. It will simply be a better place to store value.
In other words, bitcoin is the backstop for when the dollar blows up. We believe we'll see one of two things happen in the years ahead:
- Either the world adopts bitcoin as a global reserve currency,
- Or, it adopts a basket of currencies that will eventually include bitcoin.
We've even seen certain stablecoins – crypto assets that are pegged to the value of real-world assets, typically the U.S. dollar – partially collateralize themselves with bitcoin positions. And we've seen numerous corporations not only accepting bitcoin as a payment method... but also adding bitcoin to their treasuries as a way to store shareholder value for the future.
This acceptance of bitcoin and the possibility of it surviving a crash is a big reason why we expect its future value to be even higher than it is now...
And on a stage in front of hundreds of investors in October 2019 in Las Vegas, I predicted bitcoin will go to $1 million in our lifetimes.
Today, there's still a roadblock to buying bitcoin. It requires setting up an account with an exchange. One of our favorites, Coinbase, makes it simple for beginners. But the process still takes 15 to 20 minutes. Just like setting up an account at your local bank, you'll need to provide the exchange with your identity documents and debit-card or bank-account details.
Coinbase offers plenty of tutorials and instructions. It's regulated and well-respected, with a long operating history.
But it still requires doing something new. That's the roadblock most people can't get over. As long as that roadblock exists, you can get in BEFORE the masses.
But bitcoin and the overall crypto market are quickly "crossing the chasm" and going mainstream. And it makes sense, too, because we're hearing about bank accounts of protestors being frozen in Canada while companies offering bitcoin services virtually dominated Superbowl and primetime ads. In other words, the message is getting out that bitcoin and cryptocurrencies are worth the effort.
A survey published by digital asset manager Grayscale showed that 26% of American investors already own bitcoin. And 59% of those surveyed said they'd be interested in bitcoin investments. That's up from 55% last year, and it's a sharp increase from 36% in 2019.
More than half of the survey's respondents said they believe bitcoin and cryptocurrencies have a long-term place in an investment portfolio.
And it's not just bitcoin that investors are interested in... Grayscale said 87% of bitcoin owners hold other cryptocurrencies as well.
These are great signs that crypto adoption is picking up steam.
Crossing the Chasm
The technology adoption lifecycle shows how new technology gets adopted by different segments of society. Distributed across a bell curve, a small number of risk-tolerant innovators and early adopters dive in first. They're followed by the more conservative early majority. Last comes the very conservative late majority and laggards.
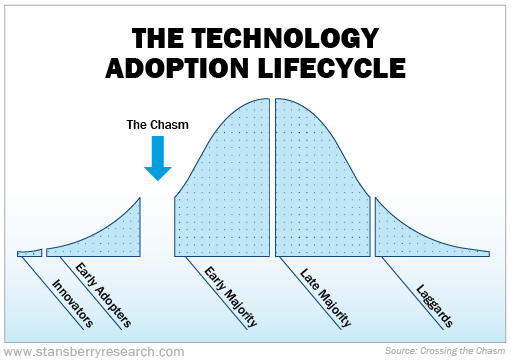
For the most part, moving from one group to the next happens organically. But the most difficult part of the cycle is called crossing the chasm. It's when a technology moves from being used by young innovators and early adopters to the more conservative, early majority of folks.
These folks tend to be older than young adopters but more forward-thinking than their peers. But for them to learn how to use a new technology, it has to be vastly better than existing solutions.
That's why many technologies never make it across the chasm.
We think that bitcoin and crypto as a whole are crossing the chasm today and are about to reach an inflection point in their adoption.
Will You Be Left Behind?
If you think technology has changed our world so far, just imagine how much faster huge new amounts of wealth will be created and how much new power will be aggregated via this new digital currency.
The simple truth is that the world has never seen a tool that's unlocking so much economic value, so quickly, for so many people all around the world.
And once you understand the even greater implications of bitcoin and the blockchain, you will realize how transformative this will all be.
The blockchain allows far more direct interaction between free and private individuals, and it removes the need for virtually all of the functions of the state and the corporation.
It's all happening right now, probably even to people you know well. And you are being left behind.
So, what should you do?
First, I strongly recommend that you watch my full presentation on this once-in-a-generation shift by clicking right here.
This will ensure that you get the facts for yourself... learn the two ways that the government is now coming for your money... and the three steps that I recommend you make NOW to protect yourself. Plus, you'll learn my price target for bitcoin and how much I expect it to increase in the next five years.
Of course, that's not all. I also detail...
- How I turned a tiny $7 investment in the dot-com era into a $1 million payday, which landed me in the pages of the Washington Post and the Wall Street Journal...
- How I went to work for one of the first businesses to use computers to make phone calls (what's known today as "voice over Internet protocol," or VOIP) back in 1999... four years before Skype was launched...
- And exactly how I learned to build powerful computers in my home, to mine and profit in the early days of cryptocurrencies...
Today, as many as 89% of Americans are getting left behind. And I hope that you won't be one of them. Click here to learn more.
Is Your Portfolio Ready for the Next Financial Crisis?
We hope you've learned something in this exclusive report... and are better prepared to protect yourself and your family when the next financial crisis comes.
While many investors think that the growth of their wealth depends on seeking out the highest-returning investments, true professionals know that success comes from finding opportunities that work in any market – or even better, surge when the other holdings in your portfolio may fall.
The unfortunate fact is that, today, most Americans are going about life, business, investing, and retirement planning as if nothing unusual has happened to our financial system.
And few seem to realize the repercussions of the trillions being pumped into the U.S. financial system in the past 18 months.
However, what that means for your portfolio, exactly, is something that we can't quite answer. After all, we don't know what you own... and we can't give personalized advice even if you told us.
But we know someone who can...
Marc Chaikin is widely regarded as a pioneer on Wall Street.
He's probably most known for creating the industry-standard "Chaikin Money Flow"...
It's a proprietary indicator used by investors and traders all over the world to analyze thousands of stocks and exchange-traded funds. It even appears in every Bloomberg terminal in the world.
For decades, he used his system to help banks grow wealthier.
But then the crash of 2008 came along.
And something happened that rubbed him the wrong way.
His wife lost around 50% of her 401(k)... all because of a bad money manager.
That's when he made a radical decision that yanked him out of retirement to create a way to see which stocks could soon double your money, by taking the same information he gave Wall Street for 50 years... and using it to give yourself a HUGE and "unfair" advantage.
He calls it the Power Gauge System. It's a chance to predict TOMORROW's stock ratings on Wall Street... in any type of market.
You simply type in any of 4,000 different tickers and see exactly where the stock is most likely to go next.
And right now, Marc Chaikin is warning that the "road map" of the stock market has gotten much harder to read in recent months.
He's worried that millions of U.S. investors are about to drive straight off a cliff. They'll make every investing mistake in the book – including missing out on one of the biggest wealth-building opportunities in recent history.
In short, a big shift is coming within the next 90 days. Learn more about what it is by clicking here.