Visualizing the Scoring Pipeline
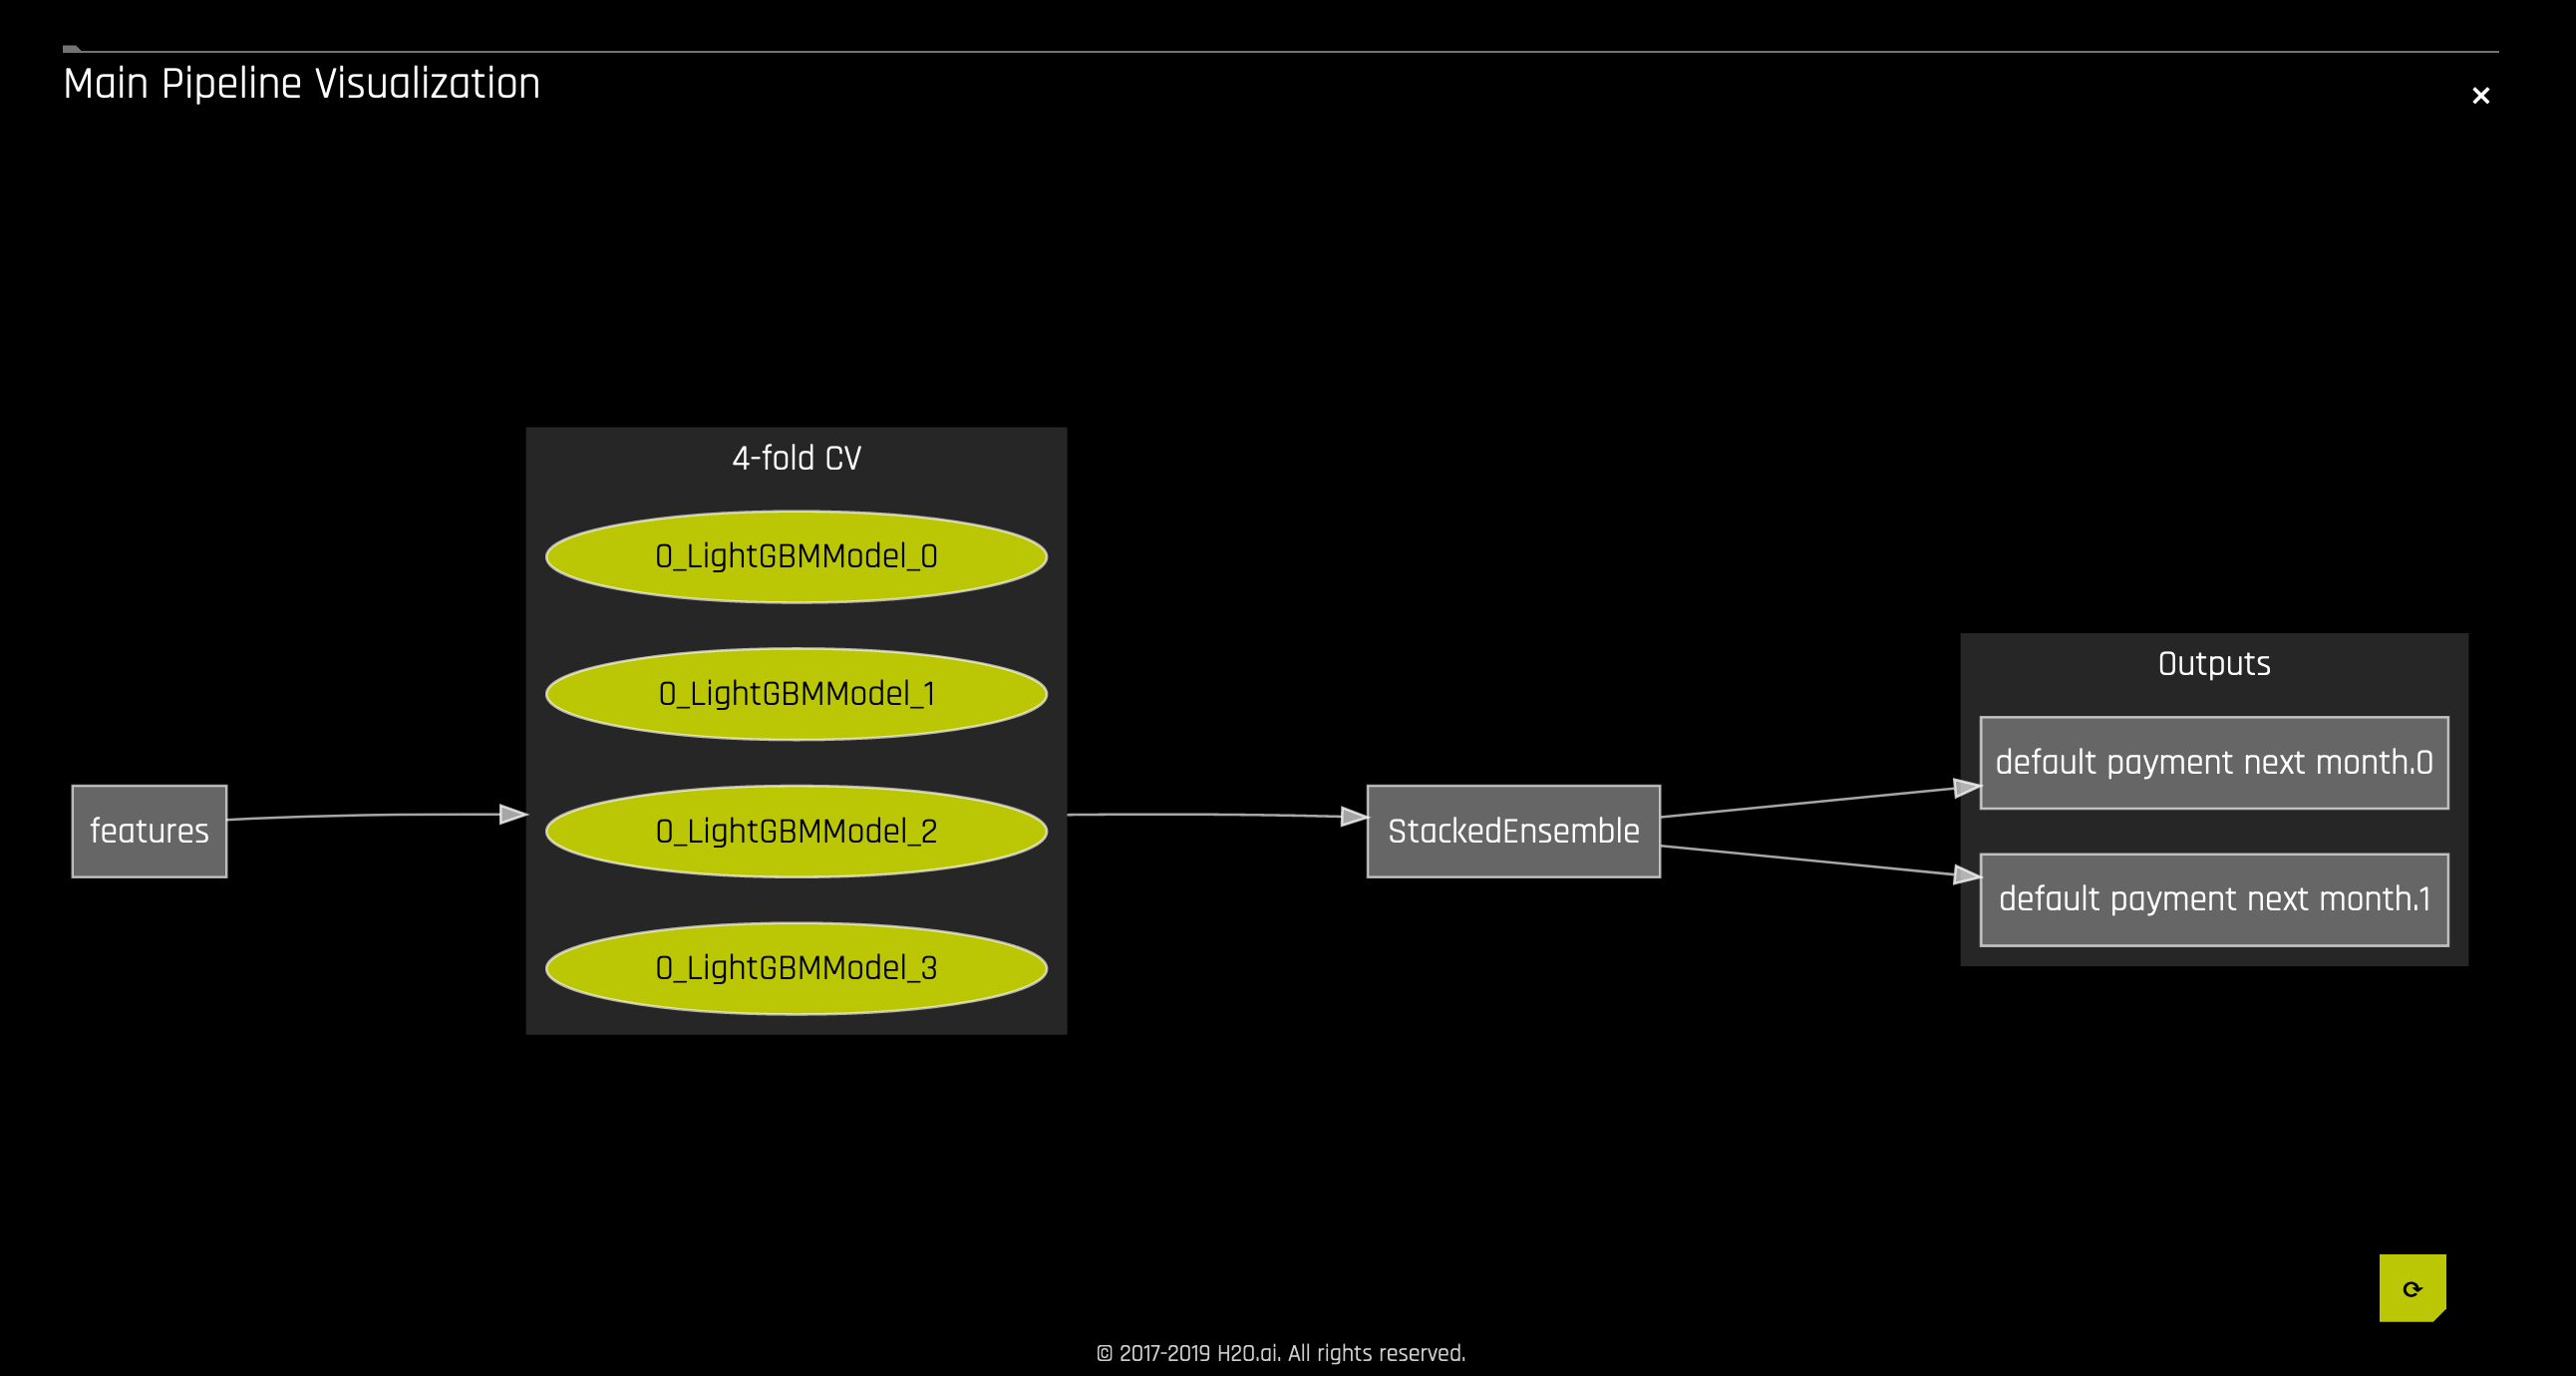
A visualization of the scoring pipeline is available for each completed experiment.
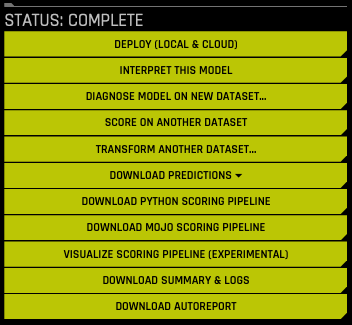
Click the Visualize Scoring Pipeline (Experimental) button on the completed experiment page to view the visualization.
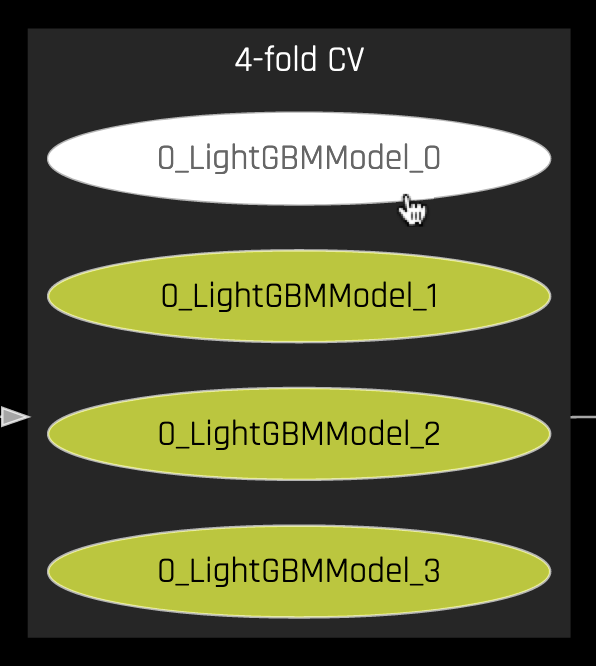
To view a visual representation of a specific model, click on the oval that corresponds with that model.
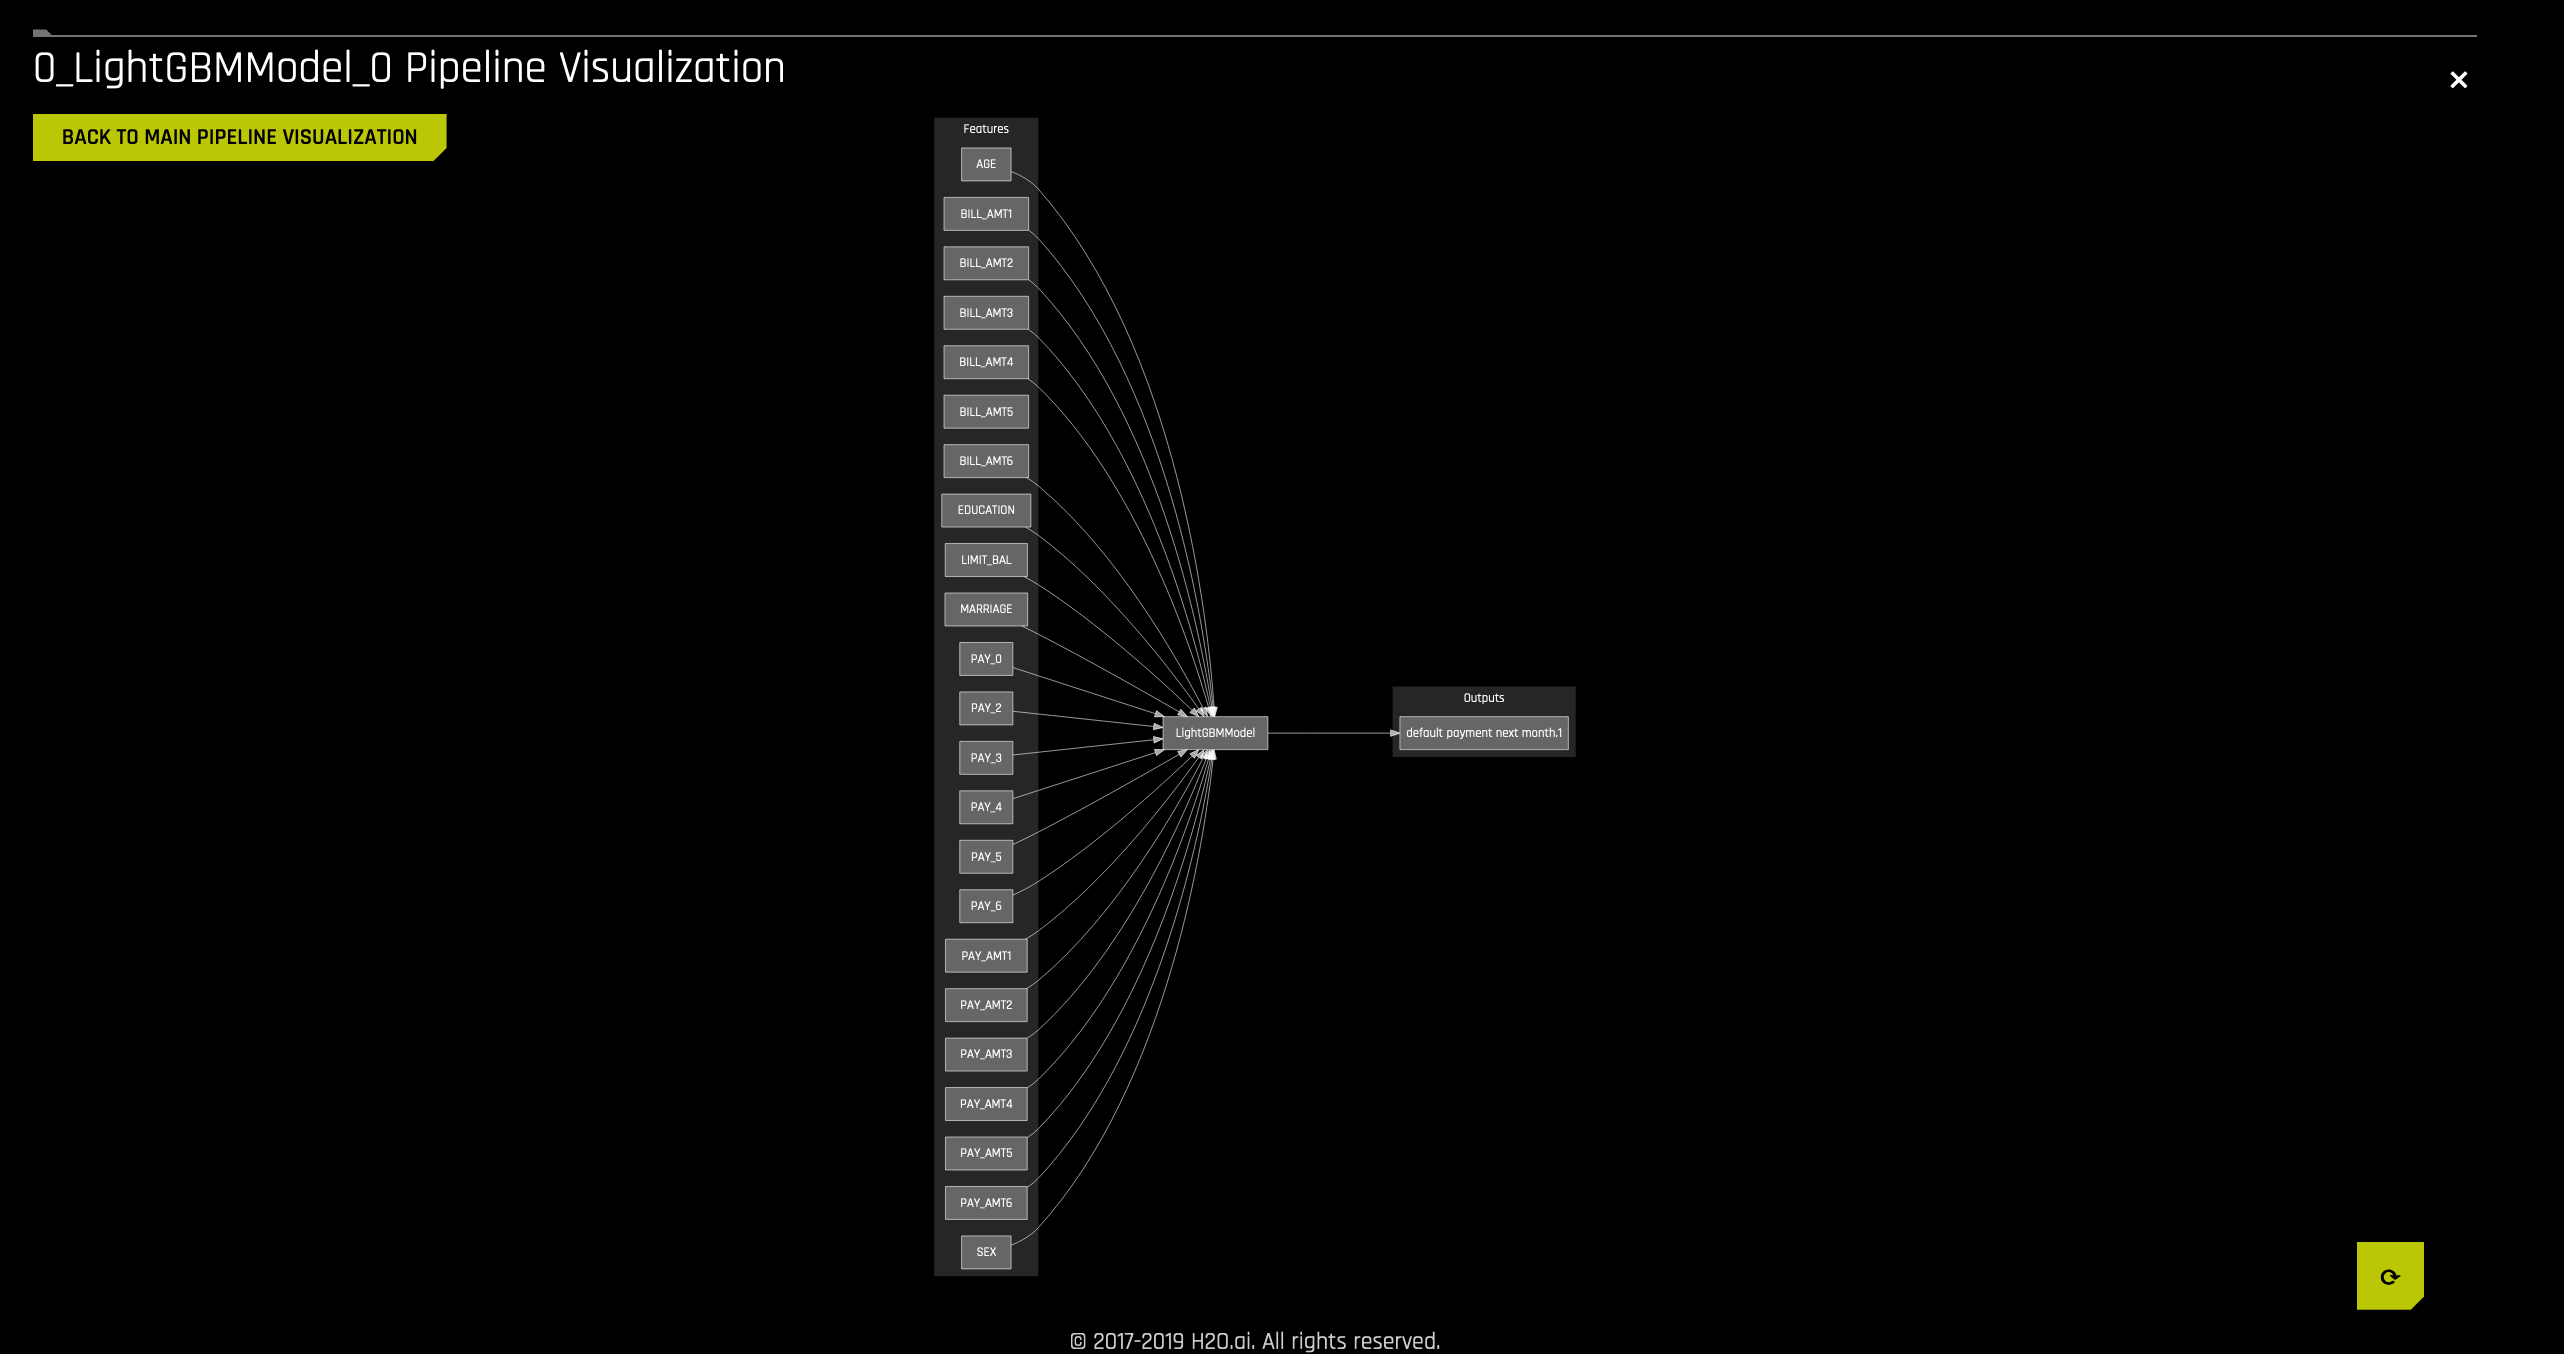
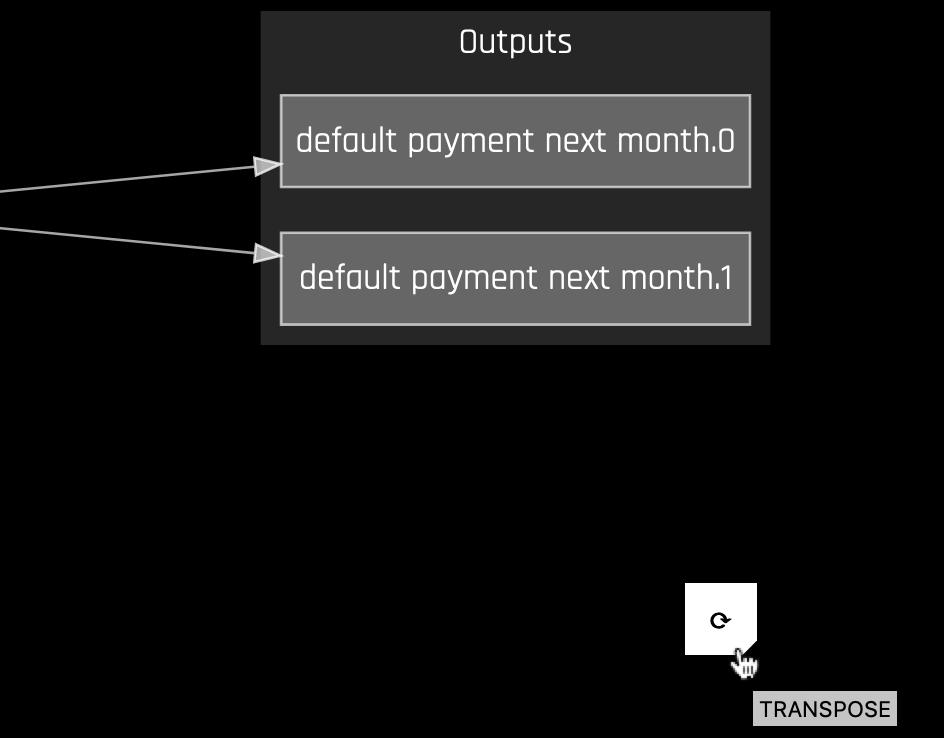
To change the orientation of the visualization, click the Transpose button in the bottom right corner of the screen.