Driverless AI Transformations
Transformations in Driverless AI are applied to columns in the data. The transformers create the engineered features in experiments.
Driverless AI provides a number of transformers. The downloaded experiment logs includes the transformations that were applied to your experiment. Note that you can blacklist transformations in the config.toml file, and that list of Blacklisted transformers will also be available in the experiment log.
Available Transformers
The following transformers are available for classification (muliclass and binary) and regression experiments.
Filter Transformer
The Filter Transformer counts each numeric value in the dataset.
Frequent Transformer
The Frequent Transformer counts each categorical value in the dataset. This count can be either the raw count or the normalized count.
Bulk Interactions Transformer
The Bulk Interactions Transformer will add, divide, multiply, and subtract two columns in the data.
Cluster Target Encoding Transformer
Selected columns in the data are clustered, and target encoding is done on the cluster ID.
Truncated SVD Numeric Transformer
Truncated SVD trains on a selected numeric of columns in the data. The components of the truncated SVD will be new features.
Cross Validation Target Encoding
Cross validation target encoding is done on a categorical column.
Cross Validation Categorical to Numeric Encoding
This transformer converts a categorical column to a numeric column. Cross validation target encoding is done on the categorical column.
Numeric to Categorical Target Encoding Transformer
This transformer converts a numeric column to categorical by binning. Cross validation target encoding is done on the binned column.
Numeric Categorical Target Encoding Transformer
This transformer takes in both numeric and categorical columns and uses them together to make new features.
Dates Transformer
The Dates Transformer retrieves any date values, including:
- Year
- Quarter
- Month
- Day
- Day of year
- Week
- Week day
- Hour
- Minute
- Second
Text Transformer
The Text Transformer transforms a text column using TFIDF (term frequency-inverse document frequency) or count (count of the word). This may be followed by dimensionality reduction using truncated SVD.
Cluster Distance Transformer
Selected columns in the data are clustered, and the distance to a chosen cluster center is calculated.
Weight of Evidence
Creates likelihood type of features using the Weights Of Evidence (WOE) transformation method. The weight of evidence tells the predictive power of an independent variable in relation to the dependent variable, for example, the measurement of good customers in relations to bad customers.
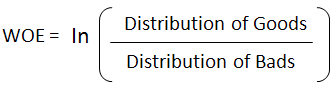
This only works with a binary target variable. The likelihood needs to be created within a stratified kfold if a fit_transform method is used. More information can be found here: http://ucanalytics.com/blogs/information-value-and-weight-of-evidencebanking-case/.
Numeric To Categorical Weight of Evidence Transformer
This transformer converts a numeric column to categorical by binning and then creates the likelihood type of features using the WOE transformation method.
Lags Transfomer
Creation of target or feature lags.
Lags Interaction Transfomer
Creation of interactions between target/feature lags (lag2 - lag1, for instance).
Lags Aggregates Transformer
Aggregations of target/feature lags like mean(lag7, lag14, lag21) with support for mean, min, max, median, sum, skew, kurtosis, std.
Is Holiday Transformer
Country-based detection for holidays; adds boolean as fetaure
Numeric to Categorical Weight of Evidence Monotonic Transformer
The Weight of Evidence or WoE measures the “strength” of a grouping for separating good and bad risk (default). Monotonic version ensures the bins of values are monotonic.
Text Linear Model Transformer
TFIDF features put into linear Model to predict target
Text CNN Transformer
CNN/GRU Tensorflow model of text feature to predict target
One Hot Encoding Transformer
One-hot encoding of a feature into multiple boolean features
Sorted Label Encoder Transformer
Label encoding (numerical assignment of categorical), but sorted numeric order by target value
Lexi Label Encoder
Label encoding (numerical assignment of categorical), but sorted by lexigraphical order of feature
Ewma Lags Transformer
Exponentially weighted moving average temporal lag of some feature
Text Cluster Distance Transformer
Cluster distance of TFIDF on feature
Text Cluster Target Encoding Transformer
Clustering of TFIDF on feature and target encoding those cluster IDs
Example Transformations
In this section, we will describe some of the available transformations using the example of predicting house prices on the example dataset.
| Date Built | Square Footage | Num Beds | Num Baths | State | Price |
|---|---|---|---|---|---|
| 01/01/1920 | 1700 | 3 | 2 | NY | $700K |
Frequent Transformer
- the count of each categorical value in the dataset
- the count can be either the raw count or the normalized count
| Date Built | Square Footage | Num Beds | Num Baths | State | Price | Freq_State |
|---|---|---|---|---|---|---|
| 01/01/1920 | 1700 | 3 | 2 | NY | 700,000 | 4,500 |
There are 4,500 properties in this dataset with state = NY.
Bulk Interactions Transformer
- add, divide, multiply, and subtract two columns in the data
| Date Built | Square Footage | Num Beds | Num Baths | State | Price | Interaction_NumBeds#subtract#NumBaths |
|---|---|---|---|---|---|---|
| 01/01/1920 | 1700 | 3 | 2 | NY | 700,000 | 1 |
There is one more bedroom than there are number of bathrooms for this property.
Truncated SVD Numeric Transformer
- truncated SVD trained on selected numeric columns of the data
- the components of the truncated SVD will be new features
| Date Built | Square Footage | Num Beds | Num Baths | State | Price | TruncSVD_Price_NumBeds_NumBaths_1 |
|---|---|---|---|---|---|---|
| 01/01/1920 | 1700 | 3 | 2 | NY | 700,000 | 0.632 |
The first component of the truncated SVD of the columns Price, Number of Beds, Number of Baths.
Dates Transformer
- get year, get quarter, get month, get day, get day of year, get week, get week day, get hour, get minute, get second
| Date Built | Square Footage | Num Beds | Num Baths | State | Price | DateBuilt_Month |
|---|---|---|---|---|---|---|
| 01/01/1920 | 1700 | 3 | 2 | NY | 700,000 | 1 |
The home was built in the month January.
Text Transformer
- transform text column using methods: TFIDF or count (count of the word)
- this may be followed by dimensionality reduction using truncated SVD
Categorical Target Encoding Transformer
- cross validation target encoding done on a categorical column
| Date Built | Square Footage | Num Beds | Num Baths | State | Price | CV_TE_State |
|---|---|---|---|---|---|---|
| 01/01/1920 | 1700 | 3 | 2 | NY | 700,000 | 550,000 |
The average price of properties in NY state is $550,000*.
*In order to prevent overfitting, Driverless AI calculates this average on out-of-fold data using cross validation.
Numeric to Categorical Target Encoding Transformer
- numeric column converted to categorical by binning
- cross validation target encoding done on the binned numeric column
| Date Built | Square Footage | Num Beds | Num Baths | State | Price | CV_TE_SquareFootage |
|---|---|---|---|---|---|---|
| 01/01/1920 | 1700 | 3 | 2 | NY | 700,000 | 345,000 |
The column Square Footage has been bucketed into 10 equally populated bins. This property lies in the Square Footage bucket 1,572 to 1,749. The average price of properties with this range of square footage is $345,000*.
*In order to prevent overfitting, Driverless AI calculates this average on out-of-fold data using cross validation.
Cluster Target Encoding Transformer
- selected columns in the data are clustered
- target encoding is done on the cluster ID
| Date Built | Square Footage | Num Beds | Num Baths | State | Price | ClusterTE_4_NumBeds_NumBaths_SquareFootage |
|---|---|---|---|---|---|---|
| 01/01/1920 | 1700 | 3 | 2 | NY | 700,000 | 450,000 |
The columns: Num Beds, Num Baths, Square Footage have been segmented into 4 clusters. The average price of properties in the same cluster as the selected property is $450,000*.
*In order to prevent overfitting, Driverless AI calculates this average on out-of-fold data using cross validation.
Cluster Distance Transformer
- selected columns in the data are clustered
- the distance to a chosen cluster center is calculated
| Date Built | Square Footage | Num Beds | Num Baths | State | Price | ClusterDist_4_NumBeds_NumBaths_SquareFootage_1 |
|---|---|---|---|---|---|---|
| 01/01/1920 | 1700 | 3 | 2 | NY | 700,000 | 0.83 |
The columns: Num Beds, Num Baths, Square Footage have been segmented into 4 clusters. The difference from this record to Cluster 1 is 0.83.