cuCRACKME is VolgaCTF 2024 Quals task, category reverse.
Task file:
Solution files solution.zip:
solution
│   cuCRACKME
│   ptx_annotated.ptx
│   ptx_original.ptx
│   ptx_patched.ptx
│
├───launch_ptx
│   │   CMakeLists.txt
│   │   launch_ptx.cpp
│   │
│   └───.vscode
│           extensions.json
│           launch.json
│           tasks.json
│
└───reversed
        CMakeLists.txt
        reversed.cpp
Summary
cuCRACKME implements a slightly modified version of block cipher Magma.
It accepts user input, encrypts it and compares with the hard-coded value. The result of comparison is output to stdout.
The flag is the correct input, therefore, solving the task requires to reverse engineer the algorithm and decrypt the hard-coded value.
|
On GPU devices with compute capability less than 5.2 (e.g. The reason is a missing check for the compute capability of GPU being used.
The correct check would be calling |
1. TL;DR
A 32-byte user input string is passed to a GPU kernel function.
The kernel is executed by 16 threads divided into 4 thread blocks. Each thread block processes an 8-byte data block of the input.
The processing is simple:
-
the user input is
XORed with constant value stored in the variablef__ -
the
XORed data is encrypted using some Feistel cipher -
the result is compared to the value stored in the variable
f___.
The Feistel cipher uses 32 rounds and its round keys are stored in the array f_______.
The cipher’s round function comprises arithmetic addition with key, nonlinear transformation based on 4 tables stored as f_____, and circular shift by 11 bits to the left.
The Feistel cipher used is Magma cipher [1] with reversed round keys order and modified substitution tables.
2. Studying the given file
We’re given an ELF file cuCRACKME which appears to be a C++ program that is linked with math library:
$ ldd cuCRACKME
	linux-vdso.so.1 (0x00007ffe6bffe000)
	libstdc++.so.6 => /lib/x86_64-linux-gnu/libstdc++.so.6 (0x00007bb9c7a00000)
	libgcc_s.so.1 => /lib/x86_64-linux-gnu/libgcc_s.so.1 (0x00007bb9c79e0000)
	libc.so.6 => /lib/x86_64-linux-gnu/libc.so.6 (0x00007bb9c7600000)
	/lib64/ld-linux-x86-64.so.2 (0x00007bb9c7d08000)
	libm.so.6 => /lib/x86_64-linux-gnu/libm.so.6 (0x00007bb9c78f9000)
However, skimming through the strings we can see CUDA framework is used:
$ strings cuCRACKME | grep -i cuda
CUDA Error: %s
__cudaInitModule
cudaGetDeviceProperties
cudaGetDriverEntryPoint
cudaMallocFromPoolAsync
cudaFreeAsync
...
So, this binary is statically linked with CUDA libraries, which suggests some of the code might be executed on a CUDA-capable device.
Running cuCRACKME we can see it’s indeed a crackme-type task:
$ ./cuCRACKME
Gimme ye kee!
my_key
nope boi :(
3. Analyzing CPU code
Let’s begin by analyzing the CPU part of the executable file.
3.1 Function main
Disassembling the main function using gdb or cuda-gdb (see section 4.4 Analysis tools) we get:
$ cuda-gdb -q cuCRACKME
Reading symbols from cuCRACKME...
(No debugging symbols found in cuCRACKME)
(cuda-gdb) set disassembly-flavor intel
(cuda-gdb) set print asm-demangle on
(cuda-gdb) disas main
Dump of assembler code for function main:
   0x000000000000aa40 <+0>:     endbr64
   0x000000000000aa44 <+4>:     push   rbp
   0x000000000000aa45 <+5>:     mov    edx,0xe
   0x000000000000aa4a <+10>:    lea    rsi,[rip+0x705ca]        # 0x7b01b
   0x000000000000aa51 <+17>:    lea    rdi,[rip+0xa0628]        # 0xab080 <std::cout@GLIBCXX_3.4>
   0x000000000000aa58 <+24>:    mov    rbp,rsp
   0x000000000000aa5b <+27>:    push   r12
   0x000000000000aa5d <+29>:    push   rbx
   0x000000000000aa5e <+30>:    lea    rbx,[rbp-0x50]              (1)
   0x000000000000aa62 <+34>:    sub    rsp,0x70
   0x000000000000aa66 <+38>:    mov    rax,QWORD PTR fs:0x28
   0x000000000000aa6f <+47>:    mov    QWORD PTR [rbp-0x18],rax
   0x000000000000aa73 <+51>:    xor    eax,eax
   0x000000000000aa75 <+53>:    mov    QWORD PTR [rbp-0x60],rbx
   0x000000000000aa79 <+57>:    mov    QWORD PTR [rbp-0x58],0x0
   0x000000000000aa81 <+65>:    mov    BYTE PTR [rbp-0x50],0x0
   0x000000000000aa85 <+69>:    call   0xa540 <std::basic_ostream<char, std::char_traits<char> >& std::__ostream_insert<char, std::char_traits<char> >(std::basic_ostream<char, std::char_traits<char> >&, char const*, long)@plt>                 (1)
   0x000000000000aa8a <+74>:    lea    rsi,[rbp-0x60]              (2)
   0x000000000000aa8e <+78>:    lea    rdi,[rip+0xa072b]        # 0xab1c0 <std::cin@GLIBCXX_3.4>
   0x000000000000aa95 <+85>:    call   0xa600 <std::basic_istream<char, std::char_traits<char> >& std::operator>><char, std::char_traits<char>, std::allocator<char> >(std::basic_istream<char, std::char_traits<char> >&, std::__cxx11::basic_string<char, std::char_traits<char>, std::allocator<char> >&)@plt>                                      (2)
   0x000000000000aa9a <+90>:    cmp    QWORD PTR [rbp-0x58],0x20   (3)
   0x000000000000aa9f <+95>:    je     0xaaf2 <main+178>
   0x000000000000aaa1 <+97>:    lea    r12,[rip+0x7055c]        # 0x7b004 -> "nop, boi"
   ...
   0x000000000000aaf1 <+177>:   ret
   0x000000000000aaf2 <+178>:   mov    rax,QWORD PTR [rbp-0x60]    (4)
   0x000000000000aaf6 <+182>:   sub    rsp,0x20
   0x000000000000aafa <+186>:   movdqu xmm0,XMMWORD PTR [rax]
   0x000000000000aafe <+190>:   movdqu xmm1,XMMWORD PTR [rax+0x10]
   0x000000000000ab03 <+195>:   movaps XMMWORD PTR [rbp-0x40],xmm0
   0x000000000000ab07 <+199>:   movups XMMWORD PTR [rsp+0x10],xmm1
   0x000000000000ab0c <+204>:   movups XMMWORD PTR [rsp],xmm0      (4)
   0x000000000000ab10 <+208>:   call   0xaf60 <check(data<32ul>)>  (5)
   0x000000000000ab15 <+213>:   add    rsp,0x20
   0x000000000000ab19 <+217>:   lea    r12,[rip+0x704f0]        # 0x7b010
   0x000000000000ab20 <+224>:   test   al,al
   0x000000000000ab22 <+226>:   jne    0xaaa8 <main+104>
   0x000000000000ab24 <+228>:   jmp    0xaaa1 <main+97>
   0x000000000000ab29 <+233>:   call   0xa520 <__stack_chk_fail@plt>
   0x000000000000ab2e <+238>:   endbr64
   0x000000000000ab32 <+242>:   mov    r12,rax
   0x000000000000ab35 <+245>:   jmp    0xaa20 <main[cold]>
End of assembler dump.
(cuda-gdb)| 1 | std::string initialization: rbp-0x60 is the string’s offset and ptr to its buffer, rbp-0x58 - its length field, rbp-0x50 - the string’s buffer |
| 2 | std::cin reads the user input into the string rbp-0x60 |
| 3 | length of the user input is checked: if it’s not equal 32 then "nop, boi"" is output (code block 0xaaa1 - 0xaaf1), otherwise execution continues |
| 4 | 32 bytes are allocated on the stack and the user data is copied to this new buffer (code block 0xaaf2 - 0xab0c) |
| 5 | the user data is passed to function check(data<32ul>) |
As we can see, the main function only does the following:
-
reads an
std::stringfromstdin -
checks if its length is equal to 32 and returns otherwise
-
copies the 32 bytes to a 32-byte array typed
data<32>as is - without any data transformation -
calls function
check, passing the user data as an argument.
|
Notice the user data |
3.2 Function check
As main does almost nothing, let’s examine the check function.
This function is relatively short and simple, however, instructions of logically coherent code blocks are intertwined and scattered throughout the whole body. Therefore, to avoid cluttering the listing with lots of callouts, we’ll split it into several parts.
Also, examining the full CFG of check we can see that normal execution (i.e. without any errors) comprises the following sequence of function calls:
-
cudaMallocManaged -
cudaMallocManaged -
__cudaPushCallConfiguration -
__cudaPopCallConfiguration -
cudaLaunchKernel -
cudaDeviceSynchronize -
cudaFree -
cudaFree.
The beginning of the function looks like this:
(cuda-gdb) disas check
Dump of assembler code for function check(data<32ul>):
   0x000000000000af60 <+0>:     endbr64
   0x000000000000af64 <+4>:     push   r12
   0x000000000000af66 <+6>:     mov    esi,0x4                             (1)
   0x000000000000af6b <+11>:    push   rbx
   0x000000000000af6c <+12>:    sub    rsp,0xc8
   0x000000000000af73 <+19>:    mov    rax,QWORD PTR fs:0x28
   0x000000000000af7c <+28>:    mov    QWORD PTR [rsp+0xb8],rax
   0x000000000000af84 <+36>:    xor    eax,eax
   0x000000000000af86 <+38>:    lea    rdx,[rsp+0x30]
   0x000000000000af8b <+43>:    lea    rax,[rsp+0x28]
   0x000000000000af90 <+48>:    movq   xmm0,rdx
   0x000000000000af95 <+53>:    movq   xmm1,rax
   0x000000000000af9a <+58>:    lea    rdi,[rsp+0x18]                      (1)
   0x000000000000af9f <+63>:    mov    edx,0x1                             (1)
   0x000000000000afa4 <+68>:    punpcklqdq xmm0,xmm1
   0x000000000000afa8 <+72>:    movaps XMMWORD PTR [rsp],xmm0
   0x000000000000afac <+76>:    call   0x51470 <cudaMallocManaged>         (1)
   0x000000000000afb1 <+81>:    test   eax,eax
   0x000000000000afb3 <+83>:    jne    0xb167 <check(data<32ul>)+519>
   0x000000000000afb9 <+89>:    lea    rdi,[rsp+0x20]                      (2)
   0x000000000000afbe <+94>:    mov    edx,0x1
   0x000000000000afc3 <+99>:    mov    esi,0x20
   0x000000000000afc8 <+104>:   call   0x51470 <cudaMallocManaged>         (2)
   0x000000000000afcd <+109>:   test   eax,eax
   0x000000000000afcf <+111>:   jne    0xb167 <check(data<32ul>)+519>
   0x000000000000afd5 <+117>:   mov    rax,QWORD PTR [rsp+0x20]            (3)
   0x000000000000afda <+122>:   xor    r9d,r9d
   0x000000000000afdd <+125>:   xor    r8d,r8d
   0x000000000000afe0 <+128>:   mov    ecx,0x1
   0x000000000000afe5 <+133>:   movdqu xmm2,XMMWORD PTR [rsp+0xe0]         (3)
   0x000000000000afee <+142>:   mov    esi,0x1
   0x000000000000aff3 <+147>:   movdqu xmm3,XMMWORD PTR [rsp+0xf0]         (3)
   0x000000000000affc <+156>:   movabs rdx,0x100000020
   0x000000000000b006 <+166>:   mov    rbx,QWORD PTR [rip+0x7005b]        # 0x7b068
   0x000000000000b00d <+173>:   mov    DWORD PTR [rsp+0x60],0x1
   0x000000000000b015 <+181>:   movabs rdi,0x100000001
   0x000000000000b01f <+191>:   movups XMMWORD PTR [rax],xmm2              (3)
   0x000000000000b022 <+194>:   movups XMMWORD PTR [rax+0x10],xmm3         (3)
   0x000000000000b026 <+198>:   mov    rax,QWORD PTR [rsp+0x18]            (4)
   0x000000000000b02b <+203>:   mov    QWORD PTR [rsp+0x48],rbx
   0x000000000000b030 <+208>:   mov    DWORD PTR [rax],0x0                 (4)
...| 1 | cudaMallocManaged is called to allocate 4 bytes and store the pointer to it at offset rsp+0x18 |
| 2 | cudaMallocManaged is called again to allocate 32 bytes and store the pointer to it at offset rsp+0x20 (code block 0xafb9 - 0xafc8) |
| 3 | the user data (located at offset rsp+0xe0 since passed on stack) is copied to the allocated buffer [rsp+0x20] |
| 4 | the four bytes [rsp+0x18] are zeroed out |
In this listing we see cudaMallocManaged function calls, its prototype can be found in the docs [2] or searching through CUDA header files:
Show the greping
$ grep -Rnw '/usr/local/cuda/targets/x86_64-linux/include/' -e 'cudaMallocManaged'
/usr/local/cuda/targets/x86_64-linux/include/cuda_runtime.h:537: * is 0, ::cudaMallocManaged returns ::cudaErrorInvalidValue. The pointer
...
/usr/local/cuda/targets/x86_64-linux/include/cuda_runtime_api.h:4969:extern __host__ __cudart_builtin__ cudaError_t CUDARTAPI cudaMallocManaged(void **devPtr, size_t size, unsigned int flags = cudaMemAttachGlobal);
/usr/local/cuda/targets/x86_64-linux/include/cuda_runtime_api.h:4971:extern __host__ __cudart_builtin__ cudaError_t CUDARTAPI cudaMallocManaged(void **devPtr, size_t size, unsigned int flags);
...
$ sed -n 4968,4973p /usr/local/cuda/targets/x86_64-linux/include/cuda_runtime_api.h
#if defined(__cplusplus)
extern __host__ __cudart_builtin__ cudaError_t CUDARTAPI cudaMallocManaged(void **devPtr, size_t size, unsigned int flags = cudaMemAttachGlobal);
#else
extern __host__ __cudart_builtin__ cudaError_t CUDARTAPI cudaMallocManaged(void **devPtr, size_t size, unsigned int flags);
#endif

$ grep -Rnw '/usr/local/cuda/targets/x86_64-linux/include/' -e '#define CUDARTAPI'
/usr/local/cuda/targets/x86_64-linux/include/crt/host_defines.h:99:#define CUDARTAPI
/usr/local/cuda/targets/x86_64-linux/include/crt/host_defines.h:135:#define CUDARTAPI \
$ sed -n 73,136p /usr/local/cuda/targets/x86_64-linux/include/crt/host_defines.h
#if defined(__CUDACC__) || defined(__CUDA_ARCH__) || defined(__CUDA_LIBDEVICE__)
/* gcc allows users to define attributes with underscores,
...
#define CUDARTAPI
#define CUDARTAPI_CDECL

#elif defined(_MSC_VER)

#if _MSC_VER >= 1400

...
#define CUDARTAPI \
        __stdcall
#if defined(__CUDACC__) || defined(__CUDA_ARCH__) || defined(__CUDA_LIBDEVICE__)
...
#define CUDARTAPI
...
#endif
extern __host__ __cudart_builtin__ cudaError_t CUDARTAPI cudaMallocManaged(
void **devPtr,
size_t size,
unsigned int flags = cudaMemAttachGlobal);Since cuCRACKME is a 64-bit ELF, CUDARTAPI is defined empty, meaning the default System V AMD64 ABI [3] is used as the calling convention.
cudaMallocManaged has three arguments:
-
a pointer to a pointer that would store the allocated memory -
rdi -
the size of the buffer -
esi -
flags (in our case always equals 1 ==
cudaMemAttachGlobal) -edx.
Analyzing the snippet above we see that the majority of the code serves to allocate a couple of managed memory buffers. The 32-byte buffer is obviously used to store the user input, while the other buffer, being 4 bytes long, looks like an int variable.
|
We’ll identify the source code types of these two buffers later. |
Next, the check function performs push and pop of the kernel’s call configuration using __cudaPushCallConfiguration and __cudaPopCallConfiguration, respectively.
The prototypes of these functions can be similarly obtained by searching the CUDA headers:
Show the greping
$ grep -Rni '/usr/local/cuda/targets/x86_64-linux/include/' -e 'cudaPushCallConfiguration'
/usr/local/cuda/targets/x86_64-linux/include/crt/device_functions.h:3634:extern "C" __host__ __device__  unsigned CUDARTAPI __cudaPushCallConfiguration(dim3 gridDim,
$ sed -n 3634,3639p /usr/local/cuda/targets/x86_64-linux/include/crt/device_functions.h
extern "C" __host__ __device__  unsigned CUDARTAPI __cudaPushCallConfiguration(dim3 gridDim,
                                      dim3 blockDim,
                                      size_t sharedMem = 0,
                                      struct CUstream_st *stream = 0);
#endif  /* __CUDACC__ */

$ grep -Rni '/usr/local/cuda/targets/x86_64-linux/include/' -e 'cudaPopCallConfiguration'
/usr/local/cuda/targets/x86_64-linux/include/crt/host_runtime.h:86:extern "C" cudaError_t CUDARTAPI __cudaPopCallConfiguration(
/usr/local/cuda/targets/x86_64-linux/include/crt/host_runtime.h:116:          if (__cudaPopCallConfiguration(&__gridDim, &__blockDim, &__sharedMem, &__stream) != cudaSuccess) \
$ sed -n 86,92p /usr/local/cuda/targets/x86_64-linux/include/crt/host_runtime.h
extern "C" cudaError_t CUDARTAPI __cudaPopCallConfiguration(
  dim3         *gridDim,
  dim3         *blockDim,
  size_t       *sharedMem,
  void         *stream
);

$ grep -Rnw '/usr/local/cuda/targets/x86_64-linux/include/' -e 'dim3'
/usr/local/cuda/targets/x86_64-linux/include/vector_types.h:418:struct __device_builtin__ dim3
/usr/local/cuda/targets/x86_64-linux/include/vector_types.h:423:    __host__ __device__ constexpr dim3(unsigned int vx = 1, unsigned int vy = 1, unsigned int vz = 1) : x(vx), y(vy), z(vz) {}
...
$ sed -n 418,435p /usr/local/cuda/targets/x86_64-linux/include/vector_types.h
struct __device_builtin__ dim3
{
    unsigned int x, y, z;
#if defined(__cplusplus)
#if __cplusplus >= 201103L
    __host__ __device__ constexpr dim3(unsigned int vx = 1, unsigned int vy = 1, unsigned int vz = 1) : x(vx), y(vy), z(vz) {}
    __host__ __device__ constexpr dim3(uint3 v) : x(v.x), y(v.y), z(v.z) {}
    __host__ __device__ constexpr operator uint3(void) const { return uint3{x, y, z}; }
#else
    __host__ __device__ dim3(unsigned int vx = 1, unsigned int vy = 1, unsigned int vz = 1) : x(vx), y(vy), z(vz) {}
    __host__ __device__ dim3(uint3 v) : x(v.x), y(v.y), z(v.z) {}
    __host__ __device__ operator uint3(void) const { uint3 t; t.x = x; t.y = y; t.z = z; return t; }
#endif
#endif /* __cplusplus */
};

typedef __device_builtin__ struct dim3 dim3;
extern "C" __host__ __device__ unsigned CUDARTAPI __cudaPushCallConfiguration(
dim3 gridDim,
dim3 blockDim,
size_t sharedMem = 0,
struct CUstream_st *stream = 0);
extern "C" cudaError_t CUDARTAPI __cudaPopCallConfiguration(
dim3 *gridDim,
dim3 *blockDim,
size_t *sharedMem,
void *stream
);
struct __device_builtin__ dim3
{
unsigned int x, y, z;
...
};gridDim and blockDim parameters are 12-byte (3 unsigned int) structures, they describe data parallelization.
Let’s see how these functions are used:
(cuda-gdb) disas check
Dump of assembler code for function check(data<32ul>):
   ...

   0x000000000000afcd <+109>:   test   eax,eax
   0x000000000000afcf <+111>:   jne    0xb167 <check(data<32ul>)+519>
   0x000000000000afd5 <+117>:   mov    rax,QWORD PTR [rsp+0x20]
   0x000000000000afda <+122>:   xor    r9d,r9d                                (3)
   0x000000000000afdd <+125>:   xor    r8d,r8d                                (3)
   0x000000000000afe0 <+128>:   mov    ecx,0x1                                (2)
   0x000000000000afe5 <+133>:   movdqu xmm2,XMMWORD PTR [rsp+0xe0]
   0x000000000000afee <+142>:   mov    esi,0x1                                (1)
   0x000000000000aff3 <+147>:   movdqu xmm3,XMMWORD PTR [rsp+0xf0]
   0x000000000000affc <+156>:   movabs rdx,0x100000020                        (2)
   0x000000000000b006 <+166>:   mov    rbx,QWORD PTR [rip+0x7005b]        # 0x7b068
   0x000000000000b00d <+173>:   mov    DWORD PTR [rsp+0x60],0x1
   0x000000000000b015 <+181>:   movabs rdi,0x100000001                        (1)
   0x000000000000b01f <+191>:   movups XMMWORD PTR [rax],xmm2
   0x000000000000b022 <+194>:   movups XMMWORD PTR [rax+0x10],xmm3
   0x000000000000b026 <+198>:   mov    rax,QWORD PTR [rsp+0x18]
   0x000000000000b02b <+203>:   mov    QWORD PTR [rsp+0x48],rbx
   0x000000000000b030 <+208>:   mov    DWORD PTR [rax],0x0
   0x000000000000b036 <+214>:   mov    rax,QWORD PTR [rip+0x70033]        # 0x7b070
   0x000000000000b03d <+221>:   mov    DWORD PTR [rsp+0x50],0x1
   0x000000000000b045 <+229>:   mov    QWORD PTR [rsp+0x58],rax
   0x000000000000b04a <+234>:   call   0x1cd80 <__cudaPushCallConfiguration>  (4)
   ...
   0x000000000000b0ba <+346>:   lea    rcx,[rsp+0x40]                         (5)
   0x000000000000b0bf <+351>:   lea    rdx,[rsp+0x38]
   0x000000000000b0c4 <+356>:   lea    rsi,[rsp+0x78]
   0x000000000000b0c9 <+361>:   lea    rdi,[rsp+0x68]                         (5)
   0x000000000000b0ce <+366>:   mov    QWORD PTR [rsp+0x68],rbx
   0x000000000000b0d3 <+371>:   mov    QWORD PTR [rsp+0x28],rax
   0x000000000000b0d8 <+376>:   mov    rax,QWORD PTR [rsp+0x20]
   0x000000000000b0dd <+381>:   mov    DWORD PTR [rsp+0x70],0x1
   0x000000000000b0e5 <+389>:   mov    QWORD PTR [rsp+0x30],rax
   0x000000000000b0ea <+394>:   mov    QWORD PTR [rsp+0x78],rbx
   0x000000000000b0ef <+399>:   mov    DWORD PTR [rsp+0x80],0x1
   0x000000000000b0fa <+410>:   movaps XMMWORD PTR [rsp+0xa0],xmm4
   0x000000000000b102 <+418>:   call   0x1ce20 <__cudaPopCallConfiguration>   (6)
...| 1 | structure dim3(x=1, y=1, z=1) is passed via registers rdi and esi (8 + 4 = 12 bytes total) |
| 2 | similarly, structure dim3(x=32, y=1, z=1) is passed via registers rdx and ecx |
| 3 | sharedMem and stream pointers are zeroed out |
| 4 | __cudaPushCallConfiguration is called |
| 5 | pointers to local variables gridDim, blockDim, sharedMem, and stream are passed vai the registers (code block 0xb0ba - 0xb0c9) |
| 6 | __cudaPopCallConfiguration is called |
A couple of notes to be made here.
First, on preparing the arguments for __cudaPushCallConfiguration we see a common optimization applied to 12-byte structures gridDim and blockDim: each is packed in two registers, rdi + esi and rdx + ecx, respectively. See [4] for more details.
Therefore, value 0x100000001 becomes x=1, y=1, 0x100000020 is treated as x=32, y=1, and the arguments are:
-
gridDim=dim3(x=1, y=1, z=1) -
blockDim=dim3(x=32, y=1, z=1).
Second, __cudaPopCallConfiguration call restores the values passed to __cudaPushCallConfiguration and saves them on stack:
-
gridDim- offsetrsp + 0x68 -
blockDim- offsetrsp + 0x78 -
sharedMem- offsetrsp + 0x38 -
stream- offsetrsp + 0x40.
Having popped the call configuration, the check function calls cudaLaunchKernel which passes execution to the GPU.
cudaLaunchKernel prototype can be found in the docs or, again, searching through CUDA headers:
Show the greping
$ grep -Rnw '/usr/local/cuda/targets/x86_64-linux/include/' -e 'cudaLaunchKernel'
/usr/local/cuda/targets/x86_64-linux/include/cuda_runtime.h:204: * \ref ::cudaLaunchKernel(const void *func, dim3 gridDim, dim3 blockDim, void **args, size_t sharedMem, cudaStream_t stream) "cudaLaunchKernel (C API)"
...
/usr/local/cuda/targets/x86_64-linux/include/cuda_runtime_api.h:13033:    extern __host__ cudaError_t CUDARTAPI cudaLaunchKernel(const void *func, dim3 gridDim, dim3 blockDim, void **args, size_t sharedMem, cudaStream_t stream);
...
$ sed -n 13033,13034p /usr/local/cuda/targets/x86_64-linux/include/cuda_runtime_api.h
    extern __host__ cudaError_t CUDARTAPI cudaLaunchKernel(const void *func, dim3 gridDim, dim3 blockDim, void **args, size_t sharedMem, cudaStream_t stream);
    extern __host__ cudaError_t CUDARTAPI cudaLaunchKernelExC(const cudaLaunchConfig_t *config, const void *func, void **args);
extern __host__ cudaError_t CUDARTAPI cudaLaunchKernel(
const void *func,
dim3 gridDim,
dim3 blockDim,
void **args,
size_t sharedMem,
cudaStream_t stream);Disassembling the relevant part of the function we see:
(cuda-gdb) disas check
Dump of assembler code for function check(data<32ul>):
   0x000000000000af60 <+0>:     endbr64
   0x000000000000af64 <+4>:     push   r12
   0x000000000000af66 <+6>:     mov    esi,0x4
   0x000000000000af6b <+11>:    push   rbx
   0x000000000000af6c <+12>:    sub    rsp,0xc8
   0x000000000000af73 <+19>:    mov    rax,QWORD PTR fs:0x28
   0x000000000000af7c <+28>:    mov    QWORD PTR [rsp+0xb8],rax
   0x000000000000af84 <+36>:    xor    eax,eax
   0x000000000000af86 <+38>:    lea    rdx,[rsp+0x30]                      (1)
   0x000000000000af8b <+43>:    lea    rax,[rsp+0x28]                      (1)
   0x000000000000af90 <+48>:    movq   xmm0,rdx                            (1)
   0x000000000000af95 <+53>:    movq   xmm1,rax                            (1)
   0x000000000000af9a <+58>:    lea    rdi,[rsp+0x18]
   0x000000000000af9f <+63>:    mov    edx,0x1
   0x000000000000afa4 <+68>:    punpcklqdq xmm0,xmm1
   0x000000000000afa8 <+72>:    movaps XMMWORD PTR [rsp],xmm0              (1)
   ...
   0x000000000000b0b0 <+336>:   mov    rax,QWORD PTR [rsp+0x18]            (1)
   0x000000000000b0b5 <+341>:   movdqa xmm4,XMMWORD PTR [rsp]
   0x000000000000b0ba <+346>:   lea    rcx,[rsp+0x40]
   0x000000000000b0bf <+351>:   lea    rdx,[rsp+0x38]
   0x000000000000b0c4 <+356>:   lea    rsi,[rsp+0x78]
   0x000000000000b0c9 <+361>:   lea    rdi,[rsp+0x68]
   0x000000000000b0ce <+366>:   mov    QWORD PTR [rsp+0x68],rbx
   0x000000000000b0d3 <+371>:   mov    QWORD PTR [rsp+0x28],rax            (1)
   0x000000000000b0d8 <+376>:   mov    rax,QWORD PTR [rsp+0x20]            (1)
   0x000000000000b0dd <+381>:   mov    DWORD PTR [rsp+0x70],0x1
   0x000000000000b0e5 <+389>:   mov    QWORD PTR [rsp+0x30],rax            (1)
   0x000000000000b0ea <+394>:   mov    QWORD PTR [rsp+0x78],rbx
   0x000000000000b0ef <+399>:   mov    DWORD PTR [rsp+0x80],0x1
   0x000000000000b0fa <+410>:   movaps XMMWORD PTR [rsp+0xa0],xmm4         (1)
   0x000000000000b102 <+418>:   call   0x1ce20 <__cudaPopCallConfiguration>
   0x000000000000b107 <+423>:   test   eax,eax
   0x000000000000b109 <+425>:   jne    0xb053 <check(data<32ul>)+243>
   0x000000000000b10f <+431>:   mov    rsi,QWORD PTR [rsp+0x68]            (3)
   0x000000000000b114 <+436>:   mov    edx,DWORD PTR [rsp+0x70]            (3)
   0x000000000000b118 <+440>:   lea    rdi,[rip+0xfffffffffffffd21]        # 0xae40 <gpu::kernel(gpu::gpu_input_t const*, int*)>                               (2)
   0x000000000000b11f <+447>:   mov    rcx,QWORD PTR [rsp+0x78]            (4)
   0x000000000000b124 <+452>:   mov    r8d,DWORD PTR [rsp+0x80]            (4)
   0x000000000000b12c <+460>:   mov    QWORD PTR [rsp+0x94],rsi
   0x000000000000b134 <+468>:   mov    DWORD PTR [rsp+0x9c],edx
   0x000000000000b13b <+475>:   mov    QWORD PTR [rsp+0x88],rcx
   0x000000000000b143 <+483>:   mov    DWORD PTR [rsp+0x90],r8d
   0x000000000000b14b <+491>:   push   QWORD PTR [rsp+0x40]
   0x000000000000b14f <+495>:   push   QWORD PTR [rsp+0x40]
   0x000000000000b153 <+499>:   lea    r9,[rsp+0xb0]                       (5)
   0x000000000000b15b <+507>:   call   0x6bc90 <cudaLaunchKernel>          (6)
   0x000000000000b160 <+512>:   pop    rdx
   0x000000000000b161 <+513>:   pop    rcx
   0x000000000000b162 <+514>:   jmp    0xb053 <check(data<32ul>)+243>
   0x000000000000b167 <+519>:   mov    edi,eax
   0x000000000000b169 <+521>:   call   0xae00 <cudaCheck(cudaError) [clone .part.0]>
   0x000000000000b16e <+526>:   call   0xa520 <__stack_chk_fail@plt>
End of assembler dump.
(cuda-gdb)| 1 | an array of pointers is formed: the offsets rsp+0x28 and rsp+0x30 are copied on stack at offset rsp+0xa0, then the pointers to the allocated managed buffers are copied to these offsets rsp+0x28 and rsp+0x30 |
| 2 | a pointer to function gpu::kernel is passed as the first argument |
| 3 | dim3(x=1, y=1, z=1) is passed via rsi and edx as gridDim argument |
| 4 | dim3(x=32, y=1, z=1) is passed via rcx and r8d as blockDim argument |
| 5 | the array of pointers is passed via r9 (notice that rsp+0xb0 was rsp+0xa0 before the two pushes at 0xb14b - 0xb14f) |
| 6 | cudaLaunchKernel is called |
Essentially, this part of check does the following:
-
makes an array of the kernel’s arguments
argson stack at offsetrsp + 0xa0, as a result theargsarray contains pointers to two buffers allocated bycudaMallocManaged(see Memory allocation) -
passes the function
gpu::kernel(gpu::gpu_input_t const*, int*)as the kernel and triggers its execution on the GPU.
Since the allocated buffers are passed as the arguments of the function gpu::kernel, we can deduce their types:
-
32-byte array of type
gpu::gpu_input_twhich pointer is stored at offsetrsp+0x20 -
4-byte
intvalue pointed by pointer stored at offsetrsp+0x18.
Having called cudaLaunchKernel the function check calls cudaDeviceSynchronize (see the docs) to wait for the kernel gpu::kernel to finish execution.
The only fragment of interest for us is the following:
(cuda-gdb) disas check
Dump of assembler code for function check(data<32ul>):
   ...
   0x000000000000b053 <+243>:   call   0x46c00 <cudaDeviceSynchronize>   (1)
   0x000000000000b058 <+248>:   test   eax,eax
   0x000000000000b05a <+250>:   jne    0xb167 <check(data<32ul>)+519>
   0x000000000000b060 <+256>:   mov    rax,QWORD PTR [rsp+0x18]          (2)
   0x000000000000b065 <+261>:   mov    rdi,QWORD PTR [rsp+0x20]
   0x000000000000b06a <+266>:   mov    eax,DWORD PTR [rax]               (2)
   0x000000000000b06c <+268>:   test   eax,eax                           (2)
   0x000000000000b06e <+270>:   sete   r12b                              (2)
   0x000000000000b072 <+274>:   call   0x51d90 <cudaFree>
   0x000000000000b077 <+279>:   mov    rdi,QWORD PTR [rsp+0x18]
   0x000000000000b07c <+284>:   call   0x51d90 <cudaFree>
   0x000000000000b081 <+289>:   mov    rax,QWORD PTR [rsp+0xb8]
   0x000000000000b089 <+297>:   sub    rax,QWORD PTR fs:0x28
   0x000000000000b092 <+306>:   jne    0xb16e <check(data<32ul>)+526>
   0x000000000000b098 <+312>:   add    rsp,0xc8
   0x000000000000b09f <+319>:   mov    eax,r12d                          (3)
   0x000000000000b0a2 <+322>:   pop    rbx
   0x000000000000b0a3 <+323>:   pop    r12
   0x000000000000b0a5 <+325>:   ret                                      (3)
...| 1 | blocking cudaDeviceSynchronize is called |
| 2 | the 4-byte int* is dereferenced and a boolean value in r12b is set if the value is zero |
| 3 | check returns that boolean value in r12b |
It’s clear that the kernel function gpu::kernel returns the result via the 4-byte int* value. Zero makes check return true, otherwise the result of the check is false.
This result is then checked in main and "yep boi :)" is output if it’s true.
3.3 Summary
To sum it up, the CPU part doesn’t do much:
-
in the
mainfunction the user input is read fromstdinas anstd::string -
mainchecks that the length of the user input is 32 bytes -
the user data is passed to the function
check -
checkallocates two buffers and copies the user input to the 32-byte buffer -
the kernel function
gpu::kernelis launched and the two allocated buffers are passed as its arguments -
the execution is blocked until
gpu::kernelreturns -
checkevaluates the kernel’s result returned through the second allocated bufferint*, treating zero value astrueresult of the check -
mainevaluates the result of the check and outputs either"yep boi :)"or"nope boi :(".
|
Note what we’ve found so far:
|
4. Overview of CUDA
At this point it is apparent that solving the task requires to analyse the GPU code.
Before we continue let’s briefly discuss CUDA execution model, the analysis tools available, and CUDA code debugging.
4.1 Execution model
Every GPU device has a lot of small "cores" designed to solve massively parallel tasks. The CUDA execution model is similarly designed [5][6][7].
The entry point into a GPU execution domain is a kernel. The execution of a kernel function is (usually) initiated from a host (i.e. CPU) side, while the kernel itself is executed on the GPU.
When a kernel is launched, two additional parameters are always specified: the block size and the grid size.
The elementary execution unit of a GPU is a thread. Since GPUs are parallel execution devices, usually multiple threads execute the same kernel in parallel.
Threads are grouped into 3-dimensional thread blocks, or just blocks. All blocks have the same size specified on the kernel launch. Each thread knows its position in the block and the size of the block - these parameters are stored in special registers.
Threads within one block can be synchronized using barriers.
A thread block can be divided into smaller thread groups. If the size of a thread group is less than 32 (the so called warp size), then threads of that group can be synchronized independently of other thread groups.
Blocks are grouped into single 3-dimensional grid. Each block knows its position in the grid and the size of the grid - these are stored in special registers as well. Consequently, the position of an individual thread within the grid can be computed (i.e. it is not stored directly).

Local variables are private to threads. However, threads within one block can have common variables that are stored in the special shared memory. Also, all threads can operate on the global memory, which is accessible from both CPU (via special functions) and GPU (via usual load/store operations, see PTX and ISA section).
All threads execute the same kernel, and the code in the CUDA program is written from the perspective of a single thread. What distinguishes the threads is which part of the data they read and process, and the main way to identify a thread is by its position within the block or (on larger scale) within the grid.
The compiled source C/C++ GPU code can be stored in two formats:
-
PTXformat - a code for an abstract GPU machine. PTX is subject for further JIT-compilation for a particular GPU that’s going to be used to execute it. Thus, PTX allows for a better portability across end-user devices, but it is more verbose. The PTX assembly language is quite simple and generally self-explanatory. -
SASSformat - an NVIDIA’s proprietary binary format used to store a code ready to be executed directly on a suitable GPU. This doesn’t require JIT-compilation and, consequently, less portable. Also, this format is, obviously, much more compact and optimized, therefore, harder to analyze.
4.2 SASS and PTX
Streaming ASSembler, SASS, is an architecture-specific (as identified by the so called compute capability) binary code format and executable (also called cubin) that is actually executed on a GPU device. SASS is specific to a particular architecture and is, therefore, not portable.
SASS is typically produced by ptxas tool (part of the CUDA toolkit), which is invoked by the nvcc compiler. A compiled architecture-specific executable cubin is usually stored within a so-called "fat binary" (see 4.3 Fat binaries and JIT caching below).
SASS is a proprietary format, however, the sets of instructions for a range of NVIDIA architectures can be found in [8].
The Parallel Thread Execution, PTX, and its Instruction Set Architecture, ISA, comprise a low-level virtual machine that exposes a GPU as a data-parallel computing device [9].
High level language compilers for CUDA and C/C++ generate PTX instructions, which are later optimized for and translated to native target-architecture instructions. An advantage of PTX over SASS is that one code can run on multiple devices: the PTX-to-GPU translator and driver enable JIT-compilation of PTX to SASS for particular architecture identified by the device’s compute capability.
On the downside, PTX generated for an older architecture may not make use of newer hardware instructions, such as new atomic operations, or tensor core instructions.
PTX syntax, memory model, the ABI and instruction set are documented in [9], ch. 4-10.
|
While SASS is proprietary and closed-source, it can be, to some extent, reverse engineered and studied. A firm understanding of PTX can help due to an inherent link between the two formats. An interested reader might find the following references useful: N.B. It appears, CudaPAD, a PTX/SASS viewer for NVIDIA CUDA code, is losing its relevance due to availability of PTX-level debugger. Last but not least, there’s always the classic approach: compiling your own increasingly more complex programs and debugging them on PTX/SASS level (GPU code debugging is discussed in 4.5 GPU code debugging). However, that is beyond the scope of the writeup. |
4.3 Fat binaries and JIT caching
Since GPUs evolve and their capabilities increase, the architecture must follow these changes. Therefore, for an application to be runnable on various generations of GPUs (including future generations) there must be a special means of forward-compatibility. NVIDIA solves this by introducing an intermediate virtual GPU ISA and PTX (see PTX and ISA) that can be JIT-compiled to any GPU architecture.
nvcc, the CUDA compiler driver, uses a two-stage compilation model. The first stage compiles C/C++ source code to PTX, and the second stage compiles the PTX to binary code for the target architecture [21].
While the first stage must be done prior to deploying the application, the second stage can be postponed and executed only at run time by the CUDA driver - to produce cubin for a specific device. This JIT compilation can cause noticeable delays on application start-up.
CUDA uses two approaches to mitigate start-up overhead on JIT compilation: JIT caching and fat binaries [22].
The idea behind JIT caching is fairly simple: whenever the device driver JIT-compiles PTX code of an application, the generated binaries are saved to avoid repeating the compilation in later invocations of the application.
The size and file system location of this cache (called compute cache) are defined by the environment variables CUDA_CACHE_MAXSIZE and CUDA_CACHE_PATH, respectively. The cache is automatically invalidated if the device driver is upgraded to avoid any potential [binary] incompatibilities and benefit from improvements in the JIT compiler.
The other means of reducing the start-up overhead is pre-building CUDA device code for a range of target architectures to produce what’s called a cubin for every compute capability, and merging them in a single fat binary file, fatbin.
When the application’s fatbin is executed on a target GPU the CUDA runtime looks for code for this GPU’s architecture in the binary, and runs it if found. If the code is missing, but PTX is present, the driver JIT-compiles the PTX.
Regardless of the host operating system, every compiled cubin is packaged as an ELF file and merged into a single fatbin. Since GPU code of an application is spawned by CPU code, fatbin is usually embedded into the host code executable. On Linux this results in a nested ELF file.
Fat binaries are produced by nvcc using -arch and -code command line arguments [23].
On Linux GPU code and metadata are stored in two additional ELF section of the CPU executable:
-
.nv_fatbinstores the GPU code, the section is split into several regions that contain a PTX code file or a cubin -
.nvFatBinSegmentcontains metadata for the.nv_fatbinsection, such as the starting addresses of its regions.
GPU ELF (cubin) embedded in the host executable is largely a regular ELF file. For every kernel function the cubin ELF describes there are the following sections:
-
.text.{func}- a section containing the kernel’s binary code; here{func}is the mangled name of the kernel -
.nv.shared.{func}- a section that is defined if the kernel function uses shared memory, section’s size gives the number of bytes of shared memory a GPU would allocate per thread block for the kernel -
.nv.constantX.{func}- similarly, these sections define the constant values used by the kernel function -
.nv.infoand.nv.info.{func}- these sections contain metadata (e.g. stack size and frame size).
|
For a brief yet more detailed discussion of CUDA binary file format see [16]. |
cuCRACKME and the embedded cubinLet’s examine the structure of the given nested ELF cuCRACKME.
First, readelf shows there are the two sections .nv_fatbin and .nvFatBinSegment in cuCRACKME:
$ readelf -S cuCRACKME
There are 35 section headers, starting at offset 0xcb2e0:

Section Headers:
  ...
  [18] .nv_fatbin        PROGBITS         0000000000089d10  00089d10
       0000000000003378  0000000000000000   A       0     0     8
  ...
  [29] .nvFatBinSegment  PROGBITS         00000000000ab058  000aa058
       0000000000000018  0000000000000000  WA       0     0     8
  ...
Key to Flags:
  W (write), A (alloc), X (execute), M (merge), S (strings), I (info),
  L (link order), O (extra OS processing required), G (group), T (TLS),
  C (compressed), x (unknown), o (OS specific), E (exclude),
  D (mbind), l (large), p (processor specific)
We can use cuobjdump tool (see 4.4 Analysis tools) to see what’s stored in .nv_fatbin section:
$ cuobjdump cuCRACKME -all -lptx -lelf
PTX file    1: cuCRACKME.1.sm_52.ptx
ELF file    1: tmpxft_001b029a_00000000-0.sm_52.cubin
Apparently, there is a PTX file and a compiled cubin for compute capability 5.2.
Using cuobjdump let’s extract the GPU ELF file and examine its sections:
$ cuobjdump cuCRACKME -xelf all
Extracting ELF file    1: tmpxft_001b02c2_00000000-0.sm_52.cubin
$ readelf -S --wide tmpxft_001b02c2_00000000-0.sm_52.cubin
There are 11 section headers, starting at offset 0x1940:

Section Headers:
  [Nr] Name              Type            Address          Off    Size   ES Flg Lk Inf Al
  [ 0]                   NULL            0000000000000000 000000 000000 00      0   0  0
  [ 1] .shstrtab         STRTAB          0000000000000000 000040 00013b 00      0   0  1
  [ 2] .strtab           STRTAB          0000000000000000 00017b 000395 00      0   0  1
  [ 3] .symtab           SYMTAB          0000000000000000 000510 000120 18      2  11  8
  [ 4] .nv.info          LOPROC+0        0000000000000000 000630 000078 00      5   0  4
  [ 5] .nv.info._ZN3gpu6kernelEPKNS_11gpu_input_tEPi LOPROC+0        0000000000000000 0006a8 0000e8 00      5   8  4
readelf: Warning: [ 6]: Link field (5) should index a symtab section.
  [ 6] .rel.text._ZN3gpu6kernelEPKNS_11gpu_input_tEPi REL             0000000000000000 000790 000080 10      5   8  8
readelf: Warning: [ 7]: Unexpected value (8) in info field.
  [ 7] .nv.constant0._ZN3gpu6kernelEPKNS_11gpu_input_tEPi PROGBITS        0000000000000000 000810 000150 00   A  0   8  4
readelf: Warning: [ 8]: Unexpected value (301989899) in info field.
  [ 8] .text._ZN3gpu6kernelEPKNS_11gpu_input_tEPi PROGBITS        0000000000000000 000960 000b80 00  AX  5 301989899 32
  [ 9] .nv.global.init   PROGBITS        0000000000000000 0014e0 000460 00  WA  0   0  8
  [10] .nv.shared._ZN3gpu6kernelEPKNS_11gpu_input_tEPi NOBITS          0000000000000000 001940 000020 00  WA  0   8  8
Key to Flags:
  W (write), A (alloc), X (execute), M (merge), S (strings), I (info),
  L (link order), O (extra OS processing required), G (group), T (TLS),
  C (compressed), x (unknown), o (OS specific), E (exclude),
  p (processor specific)
$ cu++filt _ZN3gpu6kernelEPKNS_11gpu_input_tEPi
gpu::kernel(const gpu::gpu_input_t *, int *)
In the output above we can see:
-
there is a kernel function
gpu::kernel(const gpu::gpu_input_t *, int *)defined in the cubin -
the compiled GPU code is stored in the section
.text._ZN3gpu6kernelEPKNS_11gpu_input_tEPi -
the kernel uses 32 bytes of shared memory per thread block (there is a section named
.nv.shared._ZN3gpu6kernelEPKNS_11gpu_input_tEPi, its size is 0x20 = 32 bytes) -
336 bytes of constant memory are allocated for the kernel (there is a section named
.nv.constant0._ZN3gpu6kernelEPKNS_11gpu_input_tEPiof size 0x150 = 336) -
the kernel operates on some globally accessible data defined in the section
.nv.global.init, its size is 0x460 = 1120 bytes.
Examining the contents of .nv.global.init:
$ xxd -s 0x14e0 -l 0x460 tmpxft_001b02c2_00000000-0.sm_52.cubin
000014e0: 8c17 2251 59cd 8cc9 d74c 251b ee99 6541  .."QY....L%...eA
000014f0: e5a8 df7a 211a 5a92 646a d22b 31f5 26be  ...z!.Z.dj.+1.&.
...
00001930: 9c9d 9299 9097 9394 9a96 989f 9e9b 9591  ................
we see that the first 32 bytes are actually the 32-byte array f__:
global .align 4 .b8 _ZZN3gpu6kernelEPKNS_11gpu_input_tEPiE3f__[32] = {140, 23, 34, 81, 89, 205, 140, 201, 215, 76, 37, 27, 238, 153, 101, 65, 229, 168, 223, 122, 33, 26, 90, 146, 100, 106, 210, 43, 49, 245, 38, 190};|
We’ll discuss this global array in 5. Analyzing GPU code. |
4.4 Analysis tools
The CUDA toolkit comes with special tools for debugging, profiling and examining GPU programs.
We’ve already used the tool cuobjdump [24] which allows to dump the GPU code - both SASS and PTX (in case the latter is stored in the fat binary).
The names of GPU functions can be demangled using cu++filt [24] tool. Demangling is important as it not only clarifies function names, but also provides additional information about their parameters types.
|
There’s nothing special about |
Even though static analysis is enough to solve the task cuCRACKME, debugging might be a huge help.
For debugging on a Linux platform there is cuda-gdb tool [25], which usage is quite similar to the regular gdb.
On Windows debugging can be done by the means of NVIDIA Nsight Compute interactive profiler [26] integrated into Visual Studio [27].
The main tool for profiling is the interactive profiler NVIDIA Nsight Compute [26]. Functional correctness (the absence of memory access errors and leaks, race conditions, etc.) can be verified using NVIDIA Compute Sanitizer [28].
There’s even a Dynamic Binary Instrumentation framework for CUDA code called NVBit [29].
In the next section we’ll discuss debugging of the given ELF binary cuCRACKME in detail.
4.5 GPU code debugging
cuCRACKME is an ELF binary, so it’s natural to debug it on a Linux platform (or on Windows via WSL / WSL2 [30]) using cuda-gdb tool.
Debugging with cuda-gdb is briefly discussed in 4.5.1 SASS-level debugging.
cuda-gdb only supports SASS-level debugging, which might complicate the analysis.
Nevertheless, there is a way to perform PTX-level debugging of cuCRACKME on Windows platform, as described in 4.5.2 PTX-level debugging.
4.5.1 SASS-level debugging
Assuming we’re on a Linux platform with the CUDA toolkit installed, the most suitable tool to debug a CUDA application is cuda-gdb.
We won’t discuss the details of debugging here and only outline some of the more useful additional commands (that is, CUDA-specific). For more information the reader is referred to the documentation [25] and tutorials [31][32].
-
Break on the first instruction of the launched kernel
(cuda-gdb) set cuda break_on_launch application -
Examine the current focus
(cuda-gdb) cuda device sm warp lane block thread block (0,0,0), thread (0,0,0), device 0, sm 0, warp 0, lane 0 -
Identify location of a variable:
local,shared,constorglobal(cuda-gdb) print &array $1 = (@shared int (*)[0]) 0x20 -
Examine a variable stored in the shared memory
(cuda-gdb) print *(@shared int*)0x20 $1 = 0 (cuda-gdb) x/4bx *(@shared int*)0x20 0x0: 0x00 0x00 0x00 0x00 -
Examine a variable stored in the global memory
(cuda-gdb) print *(@global int *) 0x7fffc7e00500 $1 = 1361188748 (cuda-gdb) x/16ub (@global void *) 0x7fffc7e00500 0x7fffc7e00500: 140 23 34 81 89 205 140 201 0x7fffc7e00508: 215 76 37 27 238 153 101 65 -
Examine kernel parameters
(cuda-gdb) p *(@global int * const @parameter *)0x10 $1 = (@global void * const @parameter) 0x110000</> -
Set value of a variable located in the global or shared memory
(cuda-gdb) set *((@shared int *) 0x0) = 0
(cuda-gdb) set *((@global long *) 0x7fffc7e00500) = 42
Examining registers, working with breakpoints, disassembling code ranges works just like in the regular gdb.
cuCRACKME using cuda-gdbLet’s walk through a typical debugging session using the task’s binary as a debugee.
|
Unless Meaning, should the reader try to repeat the steps of this example (or, obviously, perform any For reference, all SASS-level debugging in this writeup is done on a machine with Ubuntu 22.04, To make a concrete example, below is shown the beginning of the kernel GeForce RTX 2080 Ti
GeForce GTX 1080 Ti
As can be seen, the two SASS listings differ. |
To this end we start by setting break_on_launch, running the program and entering exactly 32 symbols. Then the execution breaks, and we find ourselves in kernel function gpu::kernel running on the GPU:
$ cuda-gdb -q cuCRACKME
Reading symbols from cuCRACKME...
(No debugging symbols found in cuCRACKME)
(cuda-gdb) set cuda break_on_launch application                             (1)
(cuda-gdb) set print asm-demangle on                                        (2)
(cuda-gdb) run                                                              (3)
Starting program: /opt/cuCRACKME
[Thread debugging using libthread_db enabled]
Using host libthread_db library "/lib/x86_64-linux-gnu/libthread_db.so.1".
Gimme ye kee!
ABCDEFGHIJKLMNOPQRSTUVWXYZABCDEF                                            (4)
[New Thread 0x7ffff52c6000 (LWP 113890)]
[Detaching after fork from child process 113891]
[New Thread 0x7fffe9fff000 (LWP 113900)]
[New Thread 0x7fffe97fe000 (LWP 113901)]
[New Thread 0x7fffe8ffd000 (LWP 113902)]
[Switching focus to CUDA kernel 0, grid 1, block (0,0,0), thread (0,0,0), device 0, sm 0, warp 0, lane 0]
0x00007fffe3258100 in gpu::kernel(gpu::gpu_input_t const*, int*)<<<(1,1,1),(32,1,1)>>> ()
(cuda-gdb)
(cuda-gdb) x/3i $pc                                                         (5)
=> 0x7fffe3258100 <gpu::kernel(gpu::gpu_input_t const*, int*)>: IMAD.MOV.U32 R1, RZ, RZ, c[0x0][0x28]
   0x7fffe3258110 <gpu::kernel(gpu::gpu_input_t const*, int*)+16>: S2UR UR4, SR_CTAID.Y
   0x7fffe3258120 <gpu::kernel(gpu::gpu_input_t const*, int*)+32>: ULDC UR8, c[0x0][0x10]
(cuda-gdb)
(cuda-gdb) cuda device sm warp lane block thread                            (6)
block (0,0,0), thread (0,0,0), device 0, sm 0, warp 0, lane 0
(cuda-gdb)
(cuda-gdb) disas                                                            (7)
Dump of assembler code for function _ZN3gpu6kernelEPKNS_11gpu_input_tEPi:
=> 0x00007fffe3258100 <+0>:     IMAD.MOV.U32 R1, RZ, RZ, c[0x0][0x28]
   0x00007fffe3258110 <+16>:    S2UR UR4, SR_CTAID.Y
   0x00007fffe3258120 <+32>:    ULDC UR8, c[0x0][0x10]
   0x00007fffe3258130 <+48>:    IMAD.MOV.U32 R0, RZ, RZ, c[0x0][0x4]
   0x00007fffe3258140 <+64>:    UMOV UR5, URZ
   ...
(cuda-gdb)| 1 | setting a kernel entry breakpoint |
| 2 | setting cpp name demangling |
| 3 | starting the binary |
| 4 | entering a 32-byte string to get past the CPU part of the binary |
| 5 | disassembling the next three instructions to verify that the execution broke in the kernel |
| 6 | examining the current focus |
| 7 | disassemble the GPU code (starting from the kernel function) |
Next, let’s examine several variables that fall into different memory ranges: shared, global, and the kernel’s parameters.
|
Again, we’re jumping ahead here, as these variables will be discussed in 5. Analyzing GPU code. For now, it’s only important to understand that the symbolic names represent global and shared arrays. Their definitions can be found in |
Locate and examine the contents of four global arrays:
global .align 4 .b8 _ZZN3gpu2f_EN18cooperative_groups4__v117thread_block_tileILj4EvEER4dataILm4EES6_ibE8f_______[32] = {144, 152, 103, ..., 120, 173};
global .align 4 .b8 _ZZN3gpu2f_EN18cooperative_groups4__v117thread_block_tileILj4EvEER4dataILm4EES6_ibE6f_____[1024] = {206, 196, 205, ..., 149, 145};
global .align 4 .b8 _ZZN3gpu6kernelEPKNS_11gpu_input_tEPiE3f__[32] = {140, 23, 34, ..., 38, 190};
global .align 4 .b8 _ZZN3gpu6kernelEPKNS_11gpu_input_tEPiE4f___[32] = {164, 144, 24, ..., 211, 213};
(cuda-gdb) p &_ZZN3gpu2f_EN18cooperative_groups4__v117thread_block_tileILj4EvEER4dataILm4EES6_ibE8f_______ (1)
$1 = (<data variable, no debug info> *) 0x7fffc7e00000 (1)
(cuda-gdb) x/32bu (@global void *) 0x7fffc7e00000 (2)
0x7fffc7e00000: 144 152 103 155 25 26 62 173 (3)
0x7fffc7e00008: 41 191 197 114 254 248 7 236
0x7fffc7e00010: 170 160 134 190 154 205 42 231
0x7fffc7e00018: 105 37 249 163 50 179 120 173
(cuda-gdb) x/32bu 0x7fffc7e00000 (4)
0x7fffc7e00000: 0 0 0 0 0 0 0 0 (4)
0x7fffc7e00008: 0 0 0 0 0 0 0 0
0x7fffc7e00010: 0 0 0 0 0 0 0 0
0x7fffc7e00018: 0 0 0 0 0 0 0 0
(cuda-gdb)
(cuda-gdb) p &_ZZN3gpu2f_EN18cooperative_groups4__v117thread_block_tileILj4EvEER4dataILm4EES6_ibE6f_____ (5)
$2 = (<data variable, no debug info> *) 0x7fffc7e00100
(cuda-gdb) x/1024ub (@global void *) 0x7fffc7e00100
0x7fffc7e00100: 206 196 205 201 197 199 202 195
0x7fffc7e00108: 204 192 194 203 207 200 193 198
0x7fffc7e00110: 158 148 157 153 149 151 154 147
...
0x7fffc7e004f8: 154 150 152 159 158 155 149 145
(cuda-gdb)
(cuda-gdb) p &_ZZN3gpu6kernelEPKNS_11gpu_input_tEPiE3f__ (6)
$3 = (<data variable, no debug info> *) 0x7fffc7e00500
(cuda-gdb) x/32ub (@global void *) 0x7fffc7e00500
0x7fffc7e00500: 140 23 34 81 89 205 140 201
0x7fffc7e00508: 215 76 37 27 238 153 101 65
0x7fffc7e00510: 229 168 223 122 33 26 90 146
0x7fffc7e00518: 100 106 210 43 49 245 38 190
(cuda-gdb)
(cuda-gdb) p &_ZZN3gpu6kernelEPKNS_11gpu_input_tEPiE4f___
$4 = (<data variable, no debug info> *) 0x7fffc7e00600
(cuda-gdb) p/u *((@global uint8_t *) 0x7fffc7e00600)@32 (7)
$5 = {164, 144, 24, 181, 54, 43, 150, 51, 173, 108, 159, 91, 67, 50, 104, 67, 156, 245, 236, 200, 77, 210, 196, 211, 2, 16, 237, 113, 133, 201, 211, 213}
(cuda-gdb)| 1 | getting location of the variable f_______ - 0x7fffc7e00000 |
| 2 | examining 32 bytes of the global data at 0x7fffc7e00000 (notice @global modifier) |
| 3 | we can see the data matches the definition {144, 152, 103, …, 120, 173} in the PTX |
| 4 | skipping @global makes cuda-gdb examine different memory range (host RAM) |
| 5 | sim. for the variable f_____[1024] = {206, 196, 205, …, 149, 145} |
| 6 | sim. for the variable f__[32] = {140, 23, 34, …, 38, 190} |
| 7 | sim. for the variable f___[32] = {164, 144, 24, …, 211, 213}; notice print (p for short) command usage |
Before resuming execution, let’s check the kernel’s arguments:
(cuda-gdb) disas
Dump of assembler code for function _ZN3gpu6kernelEPKNS_11gpu_input_tEPi:
=> 0x00007fffe3258100 <+0>:     IMAD.MOV.U32 R1, RZ, RZ, c[0x0][0x28]
   0x00007fffe3258110 <+16>:    S2UR UR4, SR_CTAID.Y
   0x00007fffe3258120 <+32>:    ULDC UR8, c[0x0][0x10]
   0x00007fffe3258130 <+48>:    IMAD.MOV.U32 R0, RZ, RZ, c[0x0][0x4]
   ...
   0x00007fffe3258320 <+544>:   IMAD.U32 R3, RZ, RZ, UR5
   0x00007fffe3258330 <+560>:   IMAD.WIDE.U32 R4, R0, R13, c[0x0][0x160]    (1)
   0x00007fffe3258340 <+576>:   IMAD.WIDE.U32 R2, R0, 0x8, R2
   0x00007fffe3258350 <+592>:   IADD3 R4, P1, R7, R4, RZ
   0x00007fffe3258360 <+608>:   IADD3 R2, P0, R7, R2, RZ
   0x00007fffe3258370 <+624>:   IMAD.X R5, RZ, RZ, R5, P1
   0x00007fffe3258380 <+640>:   IMAD.X R3, RZ, RZ, R3, P0
   0x00007fffe3258390 <+656>:   LDG.E.U8.CONSTANT.SYS R8, [R4]
   0x00007fffe32583a0 <+672>:   LDG.E.U8.CONSTANT.SYS R9, [R2]
   0x00007fffe32583b0 <+688>:   LDG.E.U8.CONSTANT.SYS R10, [R4+0x4]
   0x00007fffe32583c0 <+704>:   LDG.E.U8.CONSTANT.SYS R11, [R2+0x4]
   ...
--Type <RET> for more, q to quit, c to continue without paging--q
Quit
(cuda-gdb) x/4gx (@parameter void *) 0x160                                  (2)
0x160:  0x00007fffbe000200      0x00007fffbe000000
0x170:  0x0000000000000000      0x0000000000000000
(cuda-gdb) x/32xb (@global void * const @parameter) 0x7fffbe000200          (3)
0x7fffbe000200: 0x41  0x42  0x43  0x44  0x45  0x46  0x47  0x48
0x7fffbe000208: 0x49  0x4a  0x4b  0x4c  0x4d  0x4e  0x4f  0x50
0x7fffbe000210: 0x51  0x52  0x53  0x54  0x55  0x56  0x57  0x58
0x7fffbe000218: 0x59  0x5a  0x41  0x42  0x43  0x44  0x45  0x46
(cuda-gdb) x/s (@global void * const @parameter) 0x7fffbe000200             (3)
0x7fffbe000200: "ABCDEFGHIJKLMNOPQRSTUVWXYZABCDEF"
(cuda-gdb) p *((@global int * const @parameter) 0x7fffbe000000)             (4)
$6 = 0
(cuda-gdb)| 1 | pointers to the kernel’s arguments are stored in the constant memory c[0x0][0x160] (offset 0x160, bank 0x0) |
| 2 | examining the constant range gives the addresses of the arguments - 0x7fffbe000200 and 0x7fffbe000000 |
| 3 | examining the first argument’s data range shows the string that was input from stdin |
| 4 | the second argument is a pointer to a zero value |
One more interesting memory array named data is defined in PTX (file solution/ptx_original.ptx) to be allocated in the shared memory:
.shared .align 8 .b8 _ZZN3gpu6kernelEPKNS_11gpu_input_tEPiE4data[32]Examining it in the current state we see this memory is zeroed out, but changes during the kernel execution:
(cuda-gdb) p &_ZZN3gpu6kernelEPKNS_11gpu_input_tEPiE4data                   (1)
No symbol "_ZZN3gpu6kernelEPKNS_11gpu_input_tEPiE4data" in current context.
(cuda-gdb) x/128gx (@shared void *)0x0                                      (2)
0x0:    0x0000000000000000      0x0000000000000000
0x10:   0x0000000000000000      0x0000000000000000
...
0xf0:   0x0000000000000000      0x0000000000000000
0x100:  Error: Failed to read shared memory at address 0x100 on device 0 sm 0 warp 0, error=CUDBG_ERROR_INVALID_MEMORY_ACCESS(0x8).

(cuda-gdb) disas
Dump of assembler code for function _ZN3gpu6kernelEPKNS_11gpu_input_tEPi:
=> 0x00007fffe3258100 <+0>:     IMAD.MOV.U32 R1, RZ, RZ, c[0x0][0x28]
   0x00007fffe3258110 <+16>:    S2UR UR4, SR_CTAID.Y
   ...
   0x00007fffe3258490 <+912>:   NOP
--Type <RET> for more, q to quit, c to continue without paging--
   0x00007fffe32584a0 <+928>:   NOP
   0x00007fffe32584b0 <+944>:   CALL.REL.NOINC 0x5a0
   ...
   0x00007fffe3258660 <+1376>:  IMAD.IADD R7, R2, 0x1, R7
   0x00007fffe3258670 <+1392>:  @P0 RED.E.ADD.STRONG.GPU [UR4], R7
   0x00007fffe3258680 <+1408>:  NOP                                         (3)
   0x00007fffe3258690 <+1424>:  EXIT
   0x00007fffe32586a0 <+0>:     IADD3 R9, R2, 0x4, RZ
   ...
--Type <RET> for more, q to quit, c to continue without paging--q
Quit
(cuda-gdb) b *0x00007fffe3258680                                            (3)
Breakpoint 1 at 0x7fffe3258680
(cuda-gdb) c                                                                (3)
Continuing.

Thread 1 "cuCRACKME" hit Breakpoint 1, 0x00007fffe3258680 in gpu::kernel(gpu::gpu_input_t const*, int*)<<<(1,1,1),(32,1,1)>>> ()
(cuda-gdb) x/32gx (@shared void *)0x0
0x0:    0x5c24bb765e82ea0c      0x7656a53320c21800
0x10:   0xa1b48c76e9da0d81      0xd3489ef4692cedc1
0x20:   0x0000000000000000      0x0000000000000000
...
0xf0:   0x0000000000000000      0x0000000000000000
(cuda-gdb) x/32bx (@shared void *)0x0                                       (4)
0x0:    0x0c    0xea    0x82    0x5e    0x76    0xbb    0x24    0x5c
0x8:    0x00    0x18    0xc2    0x20    0x33    0xa5    0x56    0x76
0x10:   0x81    0x0d    0xda    0xe9    0x76    0x8c    0xb4    0xa1
0x18:   0xc1    0xed    0x2c    0x69    0xf4    0x9e    0x48    0xd3
(cuda-gdb)
(cuda-gdb) x/s (@global void * const @parameter) 0x7fffbe000200             (5)
0x7fffbe000200: "ABCDEFGHIJKLMNOPQRSTUVWXYZABCDEF"
(cuda-gdb) p *((@global int * const @parameter) 0x7fffbe000000)             (5)
$7 = 16
(cuda-gdb)| 1 | symbol _ZZN3gpu6kernelEPKNS_11gpu_input_tEPiE4data is not defined |
| 2 | examining a huge range starting at offset 0x0 tells us the offsets and the size of the shared memory; the whole range is filled with zeros in the beginning |
| 3 | setting a breakpoint and resuming execution till the end of the kernel |
| 4 | examining the shared memory shows 32 bytes were changed during execution |
| 5 | examining the kernel’s parameters once again we see the user input array was not changed, but the int pointed to by the second argument now equals 16 |
Continuing with the shared memory array data, let’s set its value to string "A"*32:
(cuda-gdb) x/6gx (@shared void *)0x0                                        (4)
0x0:    0x5c24bb7600000000      0x7656a53320c21800
0x10:   0xa1b48c76e9da0d81      0xd3489ef4692cedc1
0x20:   0x0000000000000000      0x0000000000000000
(cuda-gdb) set *((@shared int *) 0x0) = 0x41414141                          (1)
(cuda-gdb) set *((@shared int *) 0x4) = 0x41414141
(cuda-gdb) set *((@shared long *) 0x8) = 0x4141414141414141                 (2)
(cuda-gdb) x/6gx (@shared void *)0x0
0x0:    0x4141414141414141      0x4141414141414141
0x10:   0xa1b48c76e9da0d81      0xd3489ef4692cedc1
0x20:   0x0000000000000000      0x0000000000000000
(cuda-gdb) set *(@shared uint8_t [16] *) 0x10 = { \                         (3)
    65, 65, 65, 0x41, 0x41, 0x41, 0x41, 0x41, \
    0x41, 0x41, 0x41, 0x41, 0x41, 0x41, 0x41, 0x41 }
(cuda-gdb) x/6gx (@shared void *)0x0
0x0:    0x4141414141414141      0x4141414141414141
0x10:   0x4141414141414141      0x4141414141414141
0x20:   0x0000000000000000      0x0000000000000000
(cuda-gdb) x/s (@shared void *)0x0                                          (4)
0x0:    'A' <repeats 32 times>
(cuda-gdb)| 1 | overwrite the first 4 bytes at offset 0x4 |
| 2 | overwrite 8 bytes at offset 0x8 |
| 3 | overwrite 16 bytes at offset 0x10 using an array of hexadecimal and/or decimal values |
| 4 | as a result, the shared array’s value is overwritten, so that it now contains "A"*32 |
In this example we showed cuda-gdb commands necessary to control GPU code execution using breakpoints and examine various memory regions: local, shared, global, and the kernel’s parameters.
4.5.2 PTX-level debugging
While the CPU part should be debugged on a Linux platform, the GPU code doesn’t depend on the OS (because it’s executed on GPU).
Therefore, if we can find a way to extract the GPU code and spawn it on Windows, we’ll be able to debug this code on PTX level using NVIDIA Nsight Visual Studio Edition [27].
The launcher project launch_ptx does exactly this. It can be found in the solution files in folder solution/launch_ptx.
|
To spawn the PTX extracted from the task’s binary |
In this section we discuss the necessary steps to trigger JIT-compilation, loading and linking of the given PTX program. Then we’ll see the basic debugging workflow of the PTX extracted from the task’s binary.
The launcher is based on ptxjit example from the CUDA Samples provided by NVIDIA [35].
The launcher accepts path to a PTX file and optional string user_input (to be passed to the kernel) as cmd arguments, compiles and calls the kernel of the given PTX program.
The idea of the approach is fairly simple:
-
read the given file to obtain PTX text representation of the GPU code to be launched
-
use CUDA Driver API [36] to JIT-compile and load the PTX program
-
prepare the arguments and call the kernel function
-
handle the returned result.
In the following we briefly outline the main steps of the project. The launcher’s usage is shown in Example 3. Debugging cuCRACKME using Nsight Visual Studio Edition.
|
For more details the reader is referred to the fairly well-commented launcher source file |
JIT compilation is done by the function ptxJIT and comprises the following function calls:
-
cuLinkCreate accepts an array of CUjit_option options and creates a pending linker invocation
-
cuLinkAddData absorbs the PTX to be JIT-compiled as a string
-
cuLinkComplete triggers compilation
-
cuModuleLoadData loads the compiled module
-
cuModuleGetFunction locates the kernel function and exports it as CUfunction handle
-
cuLinkDestroy destroys the linker.
Essentially, this function is identical to the function ptxJIT from ptxjit. The crucial difference is two additional linker options that need to be added to enable PTX-level debugging of the launched PTX program:
-
CU_JIT_GENERATE_DEBUG_INFO=1, and -
CU_JIT_OPTIMIZATION_LEVEL=0.
These options tell the compiler to export the necessary debugging information (most importantly, the source PTX itself) and suppress optimizations.
The main function simply prepares the execution context and calls the kernel function of the given PTX program:
-
first, CUDA context is initialized using cuInit and a handle to the first (
device_id = 0) available GPU device is obtained by calling cuDeviceGet -
then cudaMallocManaged is used to allocate memory for the two kernel’s arguments: 32-byte string
gpu_inputand 4-byte integergpu_result(see Memory allocation) -
either the launcher’s second optional argument
user_input(if given) or the hard-coded ciphertext valuef___(see 5.3 The kernel function) is copied togpu_input -
the function
ptxJITdescribed above JIT-compiles and loads the given PTX program and returns a handlehKernelto its kernel function -
the kernel function is launched using cuLaunchKernel, the kernel’s launch parameters
blockandgridwere found during reversing the CPU part ofcuCRACKME(see Kernel launch) -
cudaDeviceSynchronize is used to wait for the kernel to finish
-
the second kernel’s argument,
gpu_result, is used to get the returned result and either"yep boi :)"or"nope boi :)"is output.
|
The steps 2, 3, 5-7 of the main function are, generally, the same as in As such, the launcher is closely tied to the task’s kernel function Although it can be generalized to a universal launcher tool capable of launching any PTX code, that is beyond the scope of this writeup and, honestly, not worth it. Still, an interested reader might treat it as an additional exercise. |
Building the launcher project is easy. On a Windows machine with CUDA Toolkit and NVIDIA Nsight VSE installed generate the VS solution file using cmake (from Command Prompt for VS 2022 or PowerShell for VS 2022):
solution>cd launch_ptx
solution\launch_ptx>mkdir build
solution\launch_ptx>cd build
solution\launch_ptx>cmake ..
...
-- Build files have been written to: .../solution/launch_ptx/build
solution\launch_ptx>
The launcher project’s solution file launch_ptx.sln should appear in launch_ptx\build.
Debugging with NVIDIA Nsight Visual Studio Edition is documented in [37]. In this section we discuss the main settings and commands necessary to debug GPU code.
-
Break on the first instruction of the launched kernel
To enable kernel entry breakpoint navigate to Extensions > Nsight and select Break On Launch.

-
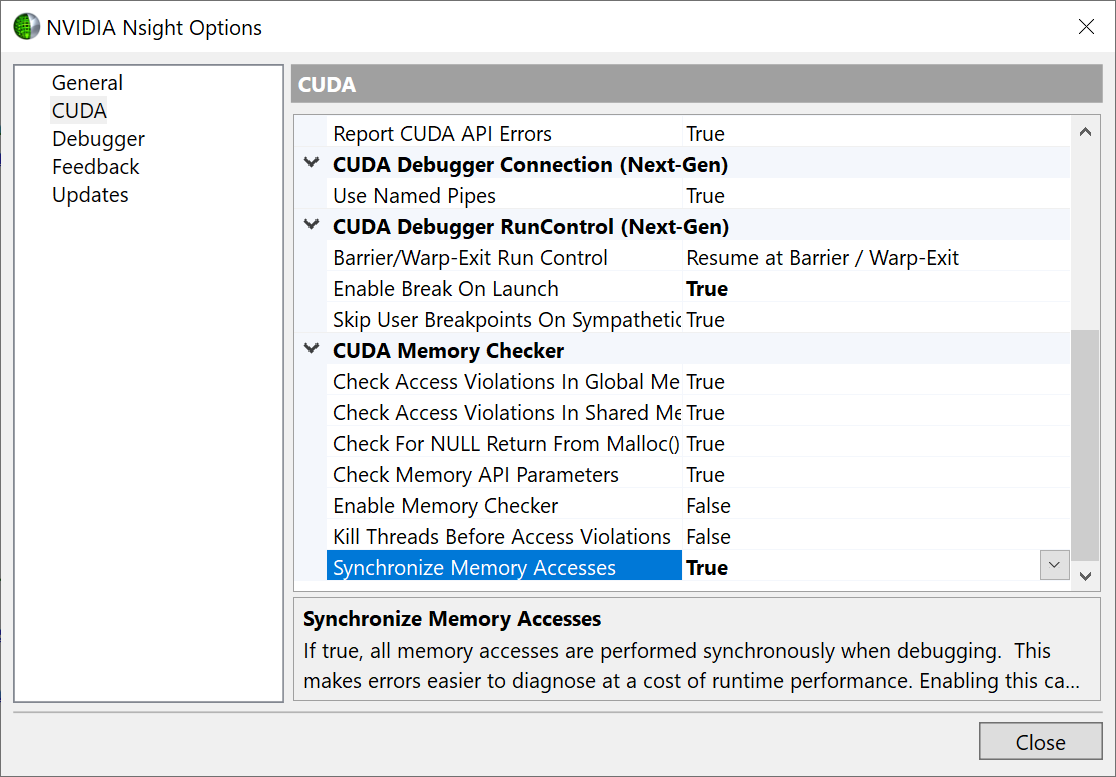
Set memory synchronization
It’s advised to enable memory synchronization. Navigate to Extensions > Nsight > Options…, select CUDA on the left panel and set Synchronize Memory Access to True.
-
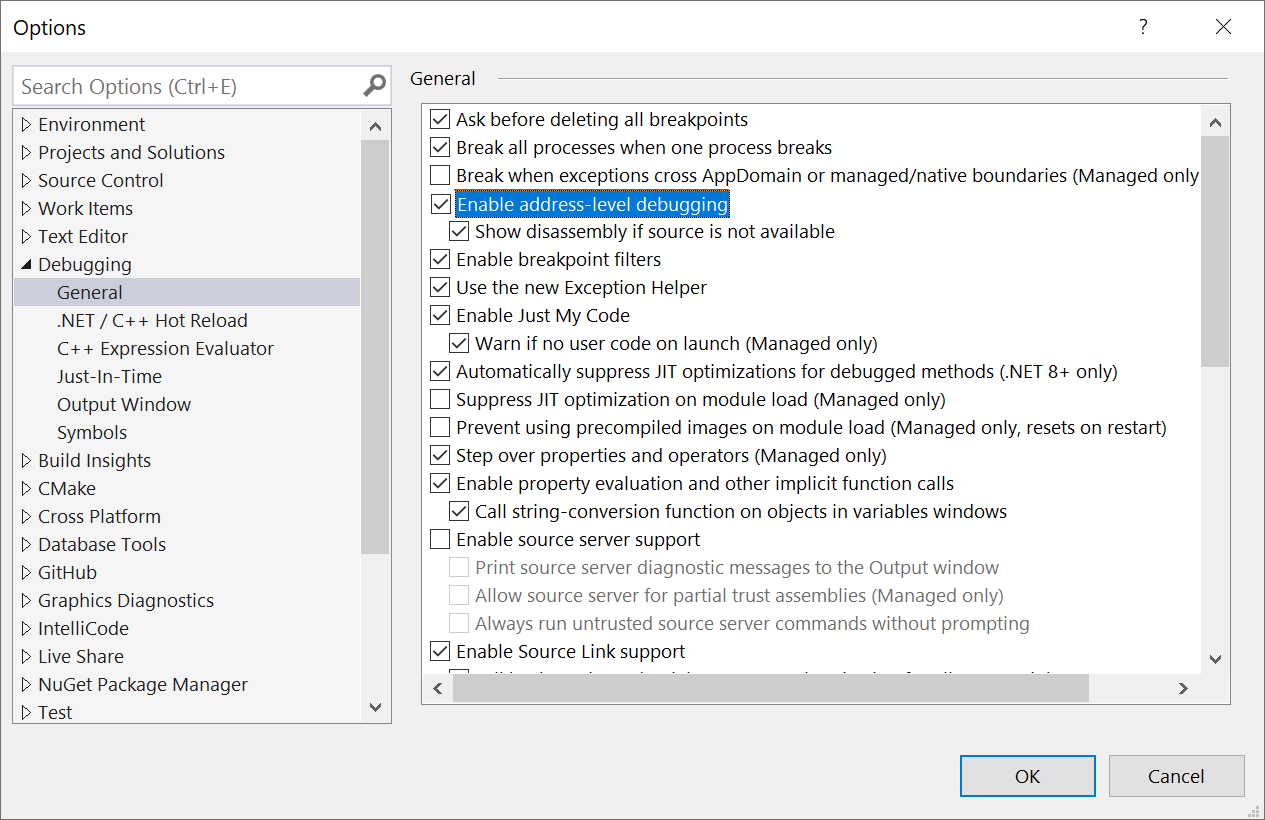
Enable PTX / SASS Assembly Debugging
Navigate to Tools > Options > Debugging, select Enable Address Level Debugging and the sub-option Show disassembly if source is not available.
-
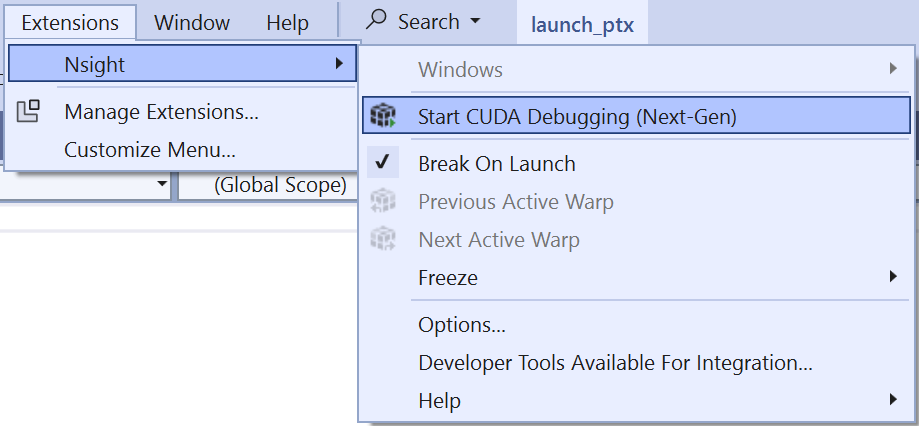
Start CUDA debugging
To start simultaneous CPU and GPU debugging (the so-called Next-Gen debugger) click Extensions > Nsight > Start CUDA Debugging (Next-Gen).
-
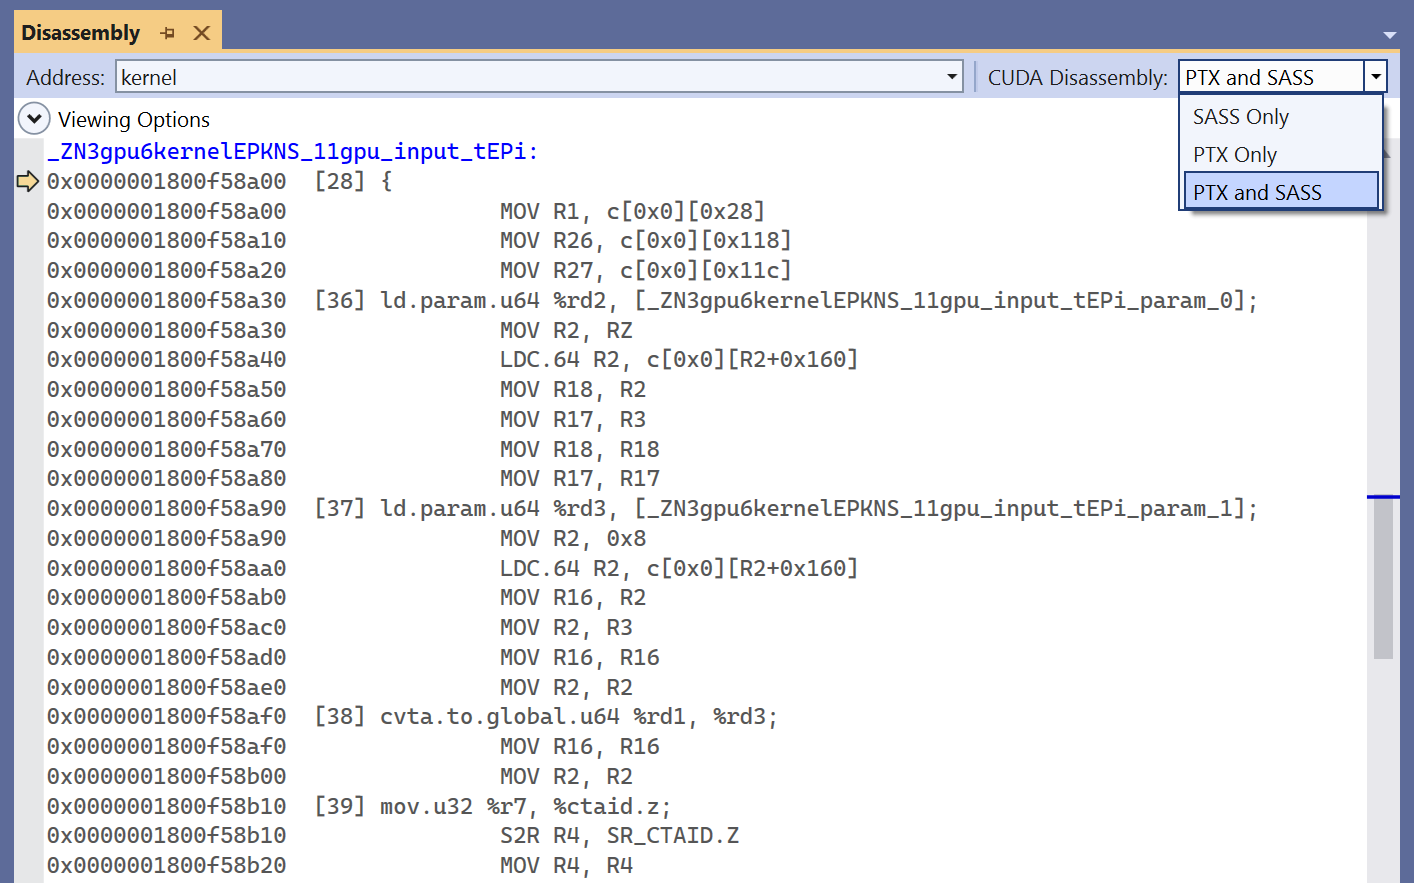
Switch between PTX / SASS views
To switch between SASS Only, PTX Only, and PTX and SASS views navigate to Disassembly window and choose the option in the drop-down menu in the upper right corner.
-
View GPU registers
To show the GPU Registers window click Extensions > Nsight > Windows > GPU Registers.
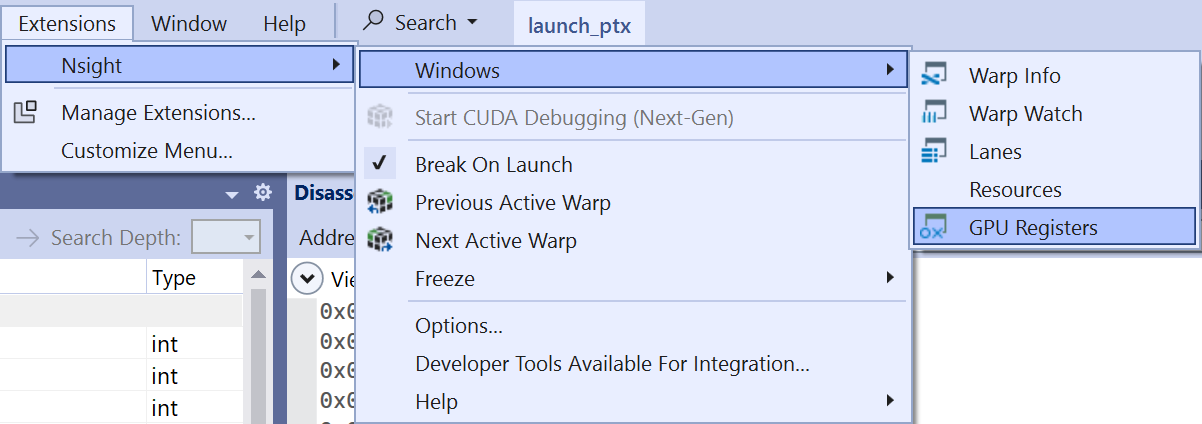
The GPU registers window shows SASS and PTX registers, PTX to SASS registers mapping (PTX Loc). PTX registers are also showed in the Locals window.
-
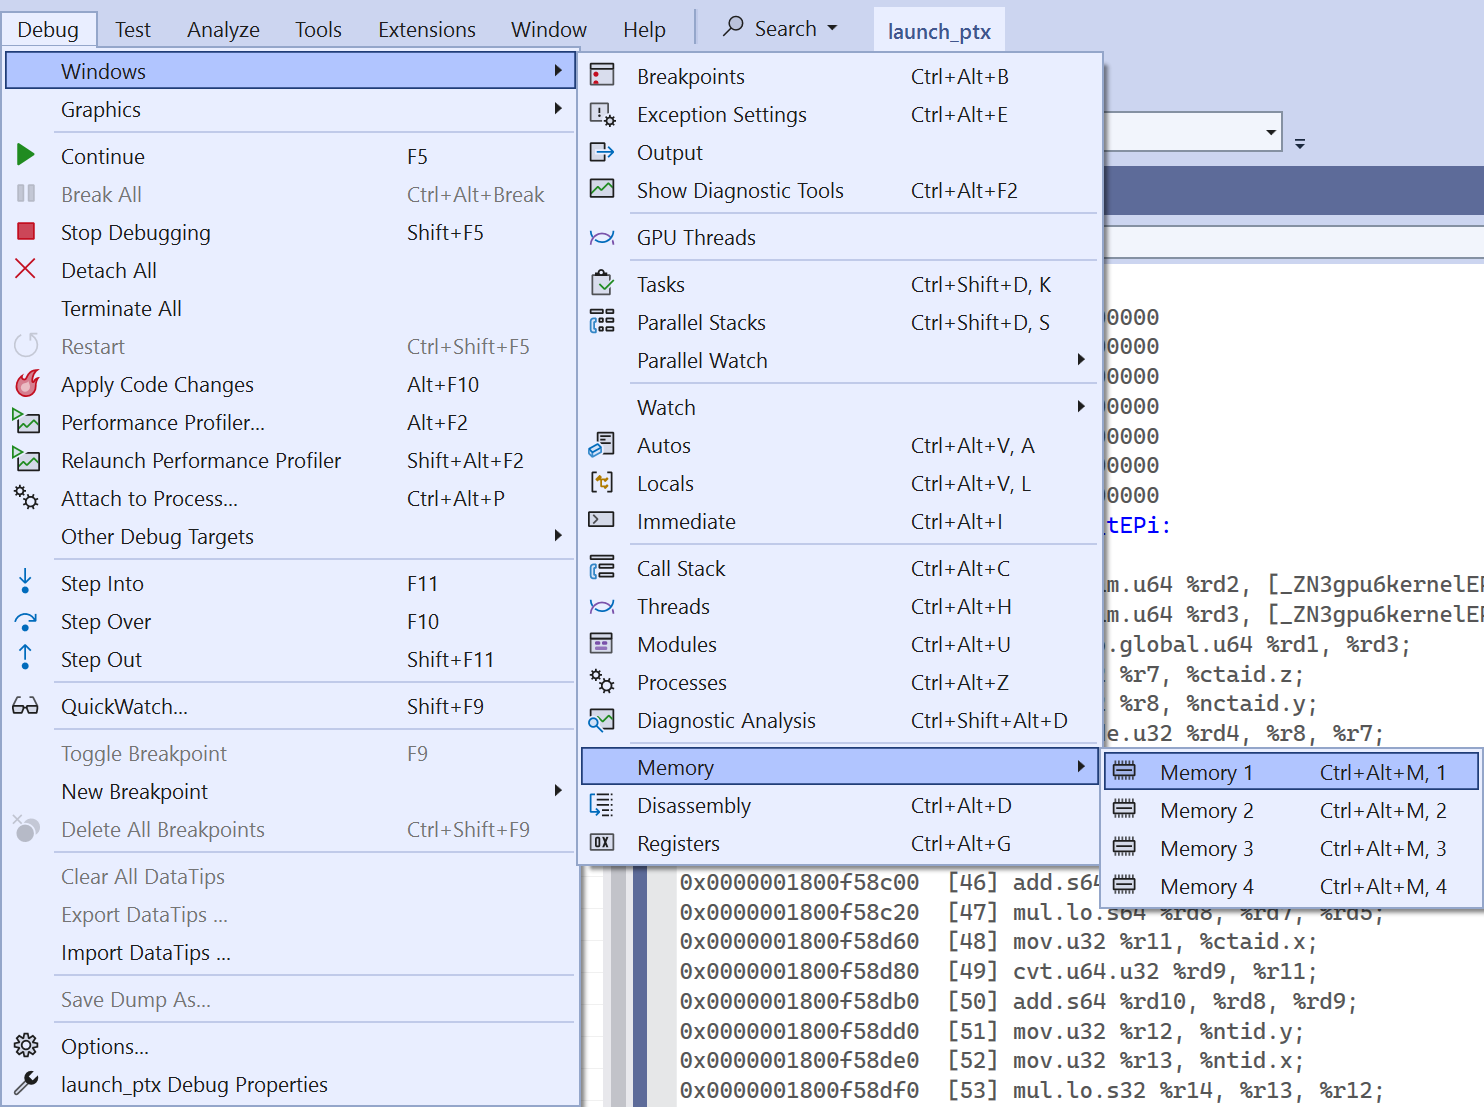
View memory ranges
To view the contents of a memory range we need one of the four Memory windows opened. Navigate to Debug > Windows > Memory and select one of the memory windows Memory x.
Then examining the contents of various memory ranges can be done using special annotations:
-
shared:(@shared int*) 0x0 -
local:(@local int*) 0x0 -
global:(@global int*) 0x204810000.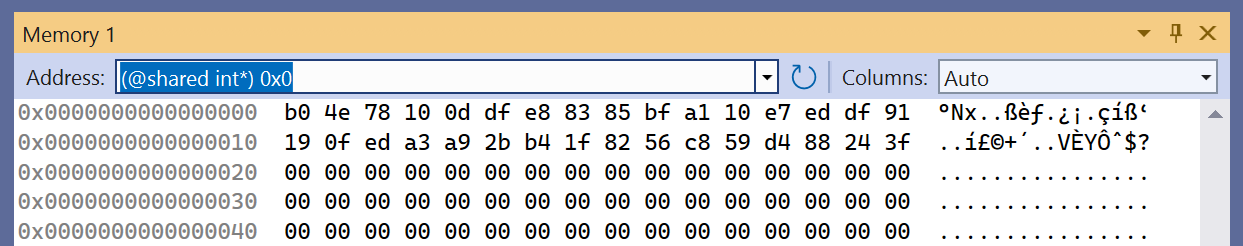
-
Working with breakpoints and controlling the execution (stepping into / over, continuing) of a GPU code is identical to that of a CPU code.
cuCRACKME using Nsight Visual Studio EditionLet’s walk through a typical debugging session in Visual Studio using cuCRACKME as a debugee.
launch_ptx project-
Build VS solution
Using
cmakeandCommand Prompt for VS 2022orPowerShell for VS 2022execute the following:solution>cd launch_ptx solution\launch_ptx>mkdir build solution\launch_ptx>cd build solution\launch_ptx>cmake .. ... -- Build files have been written to: .../solution/launch_ptx/build solution\launch_ptx> -
Configure the solution
-
Open solution file
launch_ptx\build\launch_ptx.sln. -
Rebuild solution with Build > Rebuild Solution.
-
Make sure
launch_ptxis set as start-up project (right click on projectlaunch_ptx> select Set as Startup Project). -
Following the instructions above configure the project:
-
enable kernel entry breakpoint
-
set memory synchronization
-
enable PTX / SASS Assembly Debugging.
-
-
Make sure the Command Arguments contain path to the PTX file
ptx_original.ptx(navigate to Debug > launch_ptx Debug Properties and select Debugging view).
-
Now we’re ready to start debugging. Note that we can also debug the CPU part, if necessary.
Select Extensions > Nsight > Start CUDA Debugging (Next-Gen). After barely noticeable delay the execution will break on the first instruction of the GPU code.
Following the instructions above configure additional project settings:
-
select PTX / SASS views, choosing either PTX Only or PTX and SASS
-
open GPU Registers window
-
open at least one Memory window.
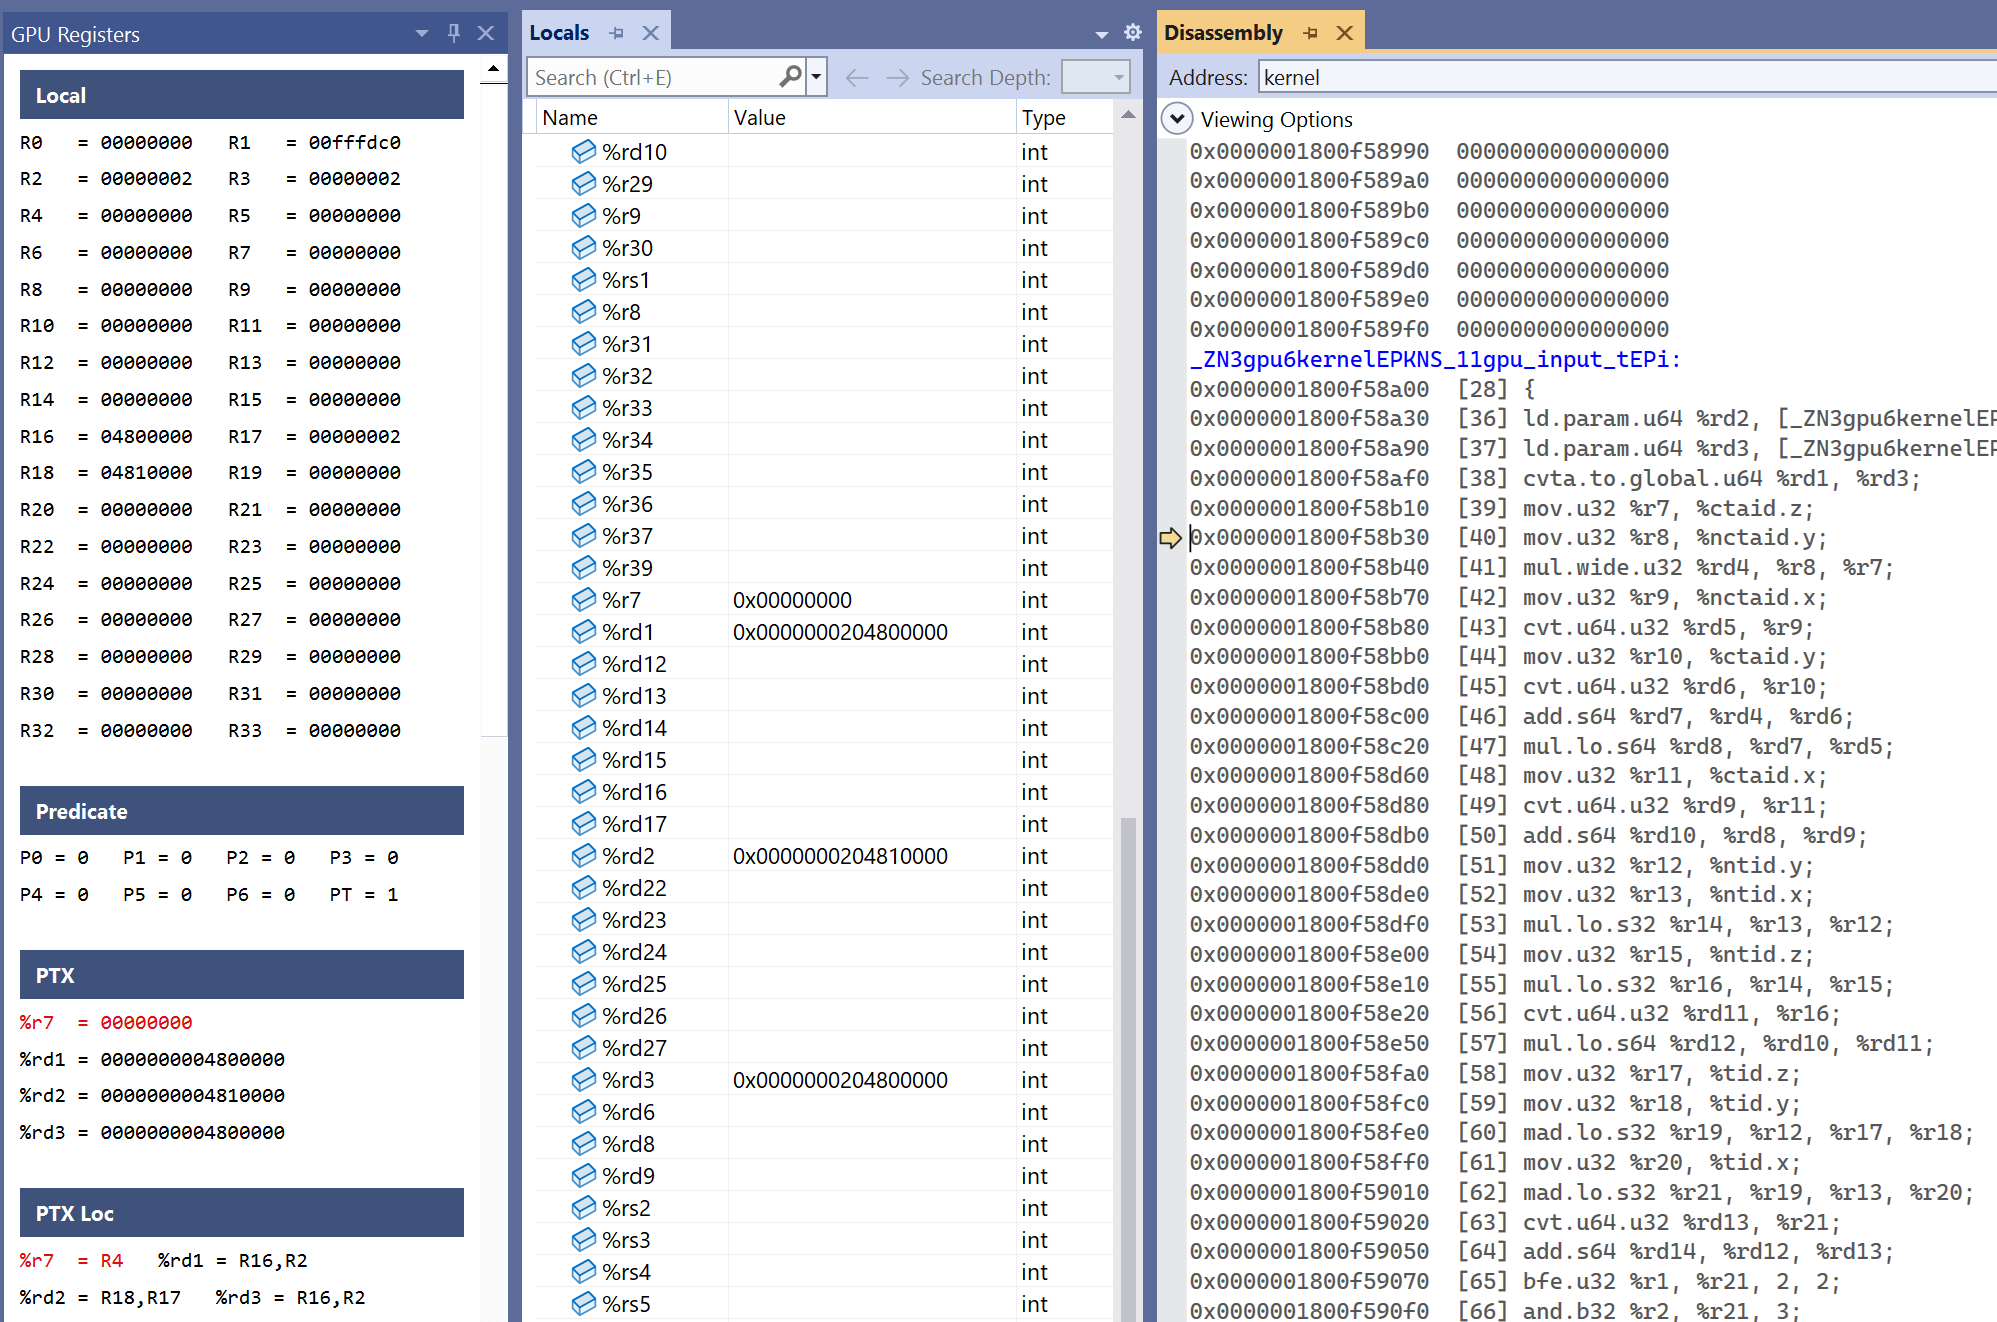
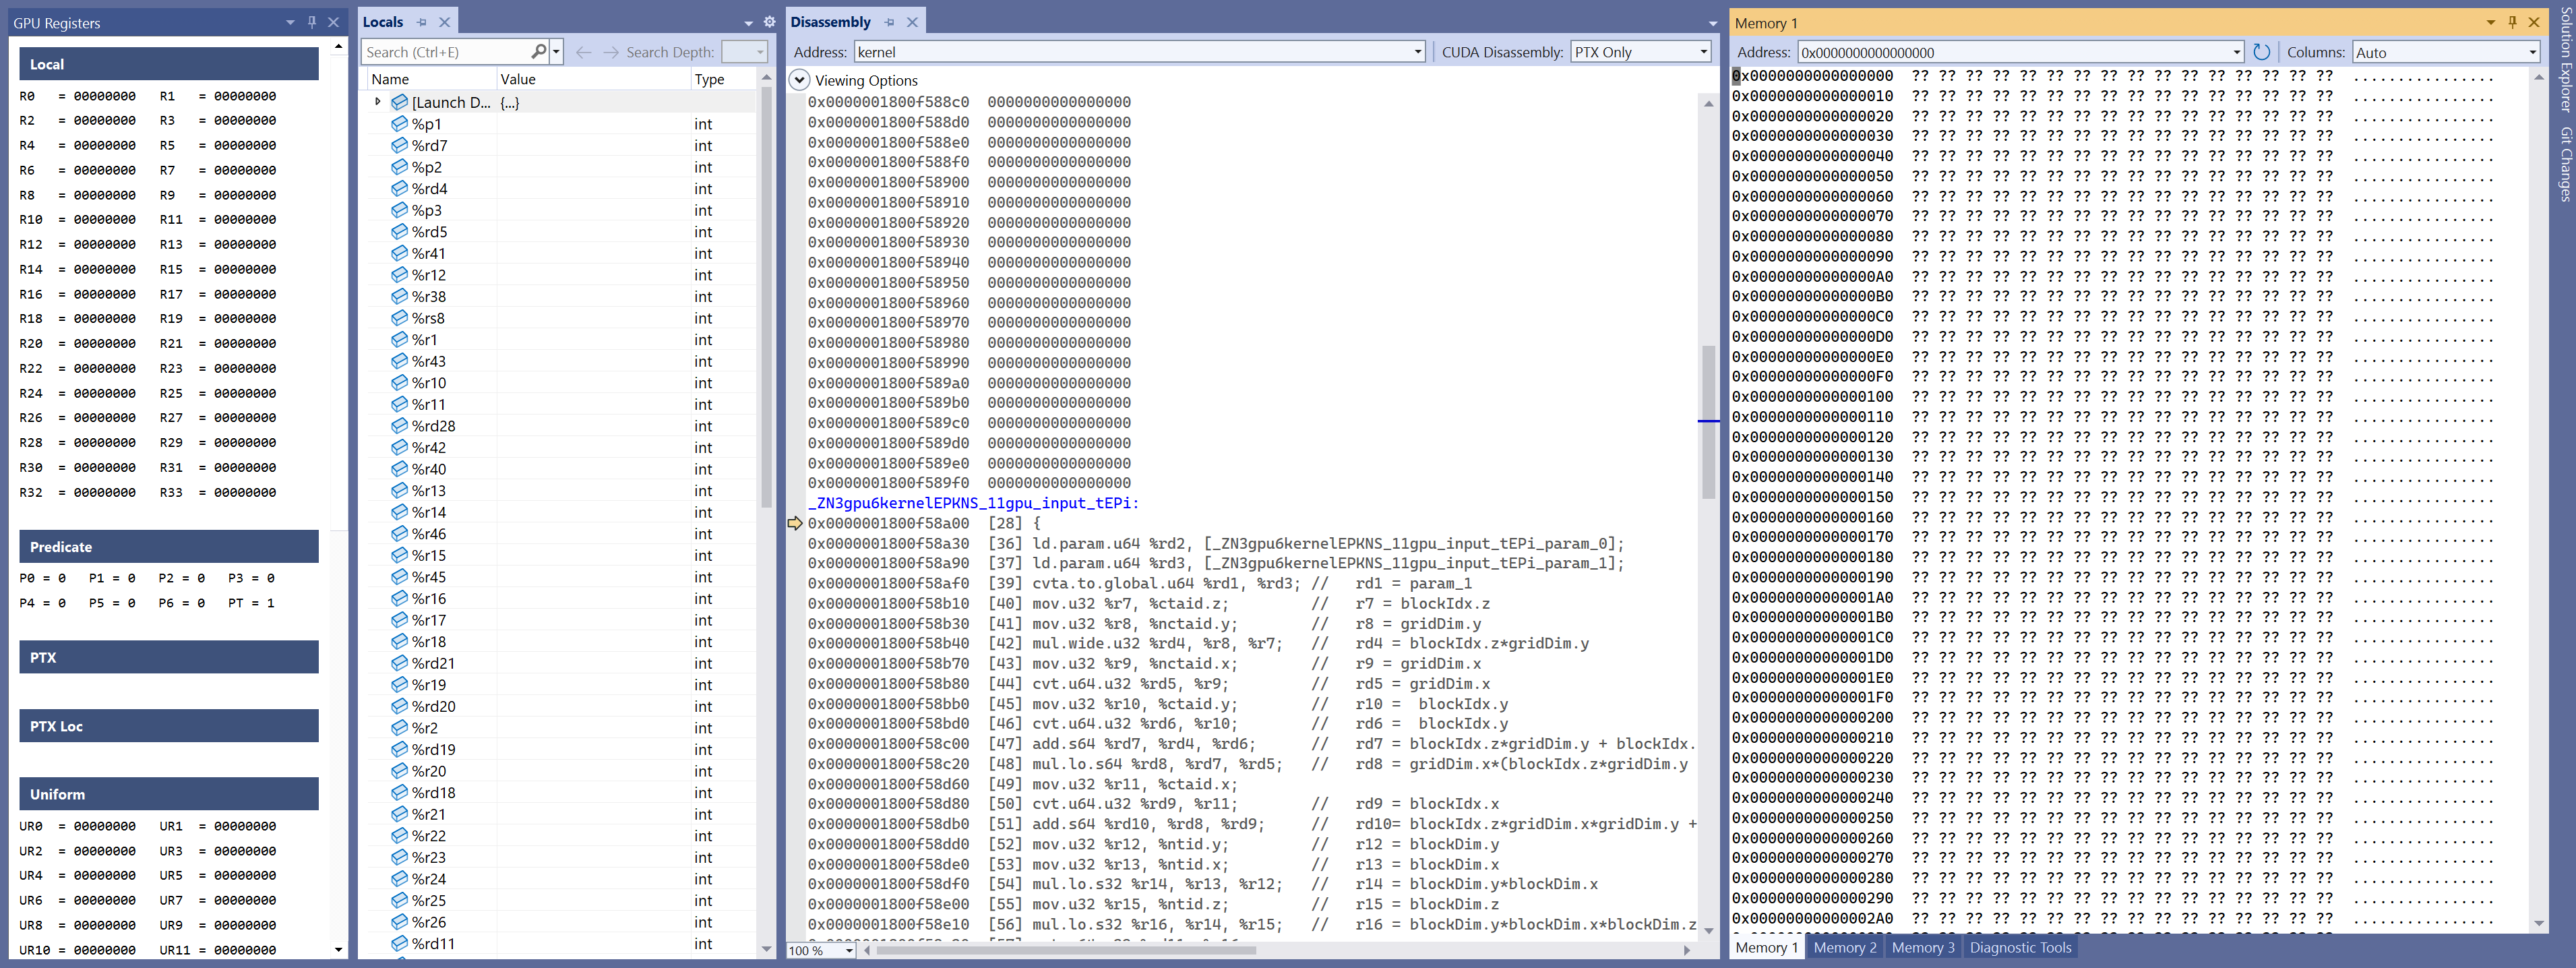
Having done these steps, the workspace should resemble the image below.
Now we can set breakpoints on PTX code lines or SASS instructions, examine memory, etc.
Let’s check the kernel’s arguments. Single-stepping or resuming execution until line 39 we see the addresses of the arguments:

In the Locals window we can see addresses in registers %rd2 and %rd3:
-
param_0- 32-byte array at offset0x204810000 -
param_1- 4-byte integer at offset0x204800000.
|
Whenever a 64-bit value is handled by a devise that only equipped with 32-bit registers the value is split in halves and two registers are used to store it. In the image above we can see that the two 64-bit offsets are stored in the registers |
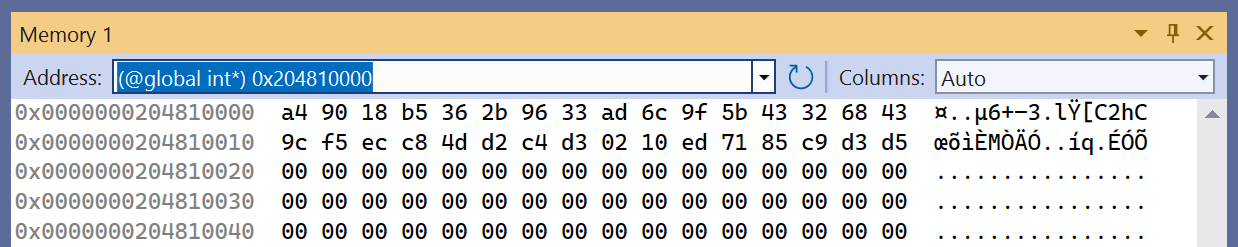
To examine the arguments we need to evaluate the following address expressions in the Memory window: (@global int*)0x204810000 and (@global int*)0x204800000.

As can be seen, the first 32-byte array stores the user input string ABCDEFGHIJKLMNOPQRSTUVWXYZABCDEF (see the debugger’s Command Arguments). The other argument equals 0x2a = 42 which is the value the second argument is initialized to in the launcher’s main function (see solution/launch_ptx/launch_ptx.cpp).
Next, let’s locate and examine the contents of four global arrays:
global .align 4 .b8 _ZZN3gpu2f_EN18cooperative_groups4__v117thread_block_tileILj4EvEER4dataILm4EES6_ibE8f_______[32] = {144, 152, 103, ..., 120, 173};
global .align 4 .b8 _ZZN3gpu2f_EN18cooperative_groups4__v117thread_block_tileILj4EvEER4dataILm4EES6_ibE6f_____[1024] = {206, 196, 205, ..., 149, 145};
global .align 4 .b8 _ZZN3gpu6kernelEPKNS_11gpu_input_tEPiE3f__[32] = {140, 23, 34, ..., 38, 190};
global .align 4 .b8 _ZZN3gpu6kernelEPKNS_11gpu_input_tEPiE4f___[32] = {164, 144, 24, ..., 211, 213};
Setting breakpoint on line 100 of the PTX listing and resuming execution we break at the 100th line:

The address of _ZZN3gpu6kernelEPKNS_11gpu_input_tEPiE3f__ is 0x1817c00500 (it’s stored in register %rd16).
In a similar fashion we can locate the addresses of the other arrays:
-
f_______-0x1817c00000 -
f_____-0x1817c00100 -
f__-0x1817c00500 -
f___-0x1817c00600.
Making the Memory window to display 16 unsigned ints in a row and examining the global memory at the found offsets:


we can see the values of the globally accessible arrays matching those defined in the PTX code.
In the PTX code (file solution/ptx_original.ptx) there is a 32-byte array data defined to be stored in the shared memory:
.shared .align 8 .b8 _ZZN3gpu6kernelEPKNS_11gpu_input_tEPiE4data[32]In a similar fashion, to get the offset of this data array, we can set a breakpoint on line 112 and resume execution to find it stored in register %r34:

Examining data at this point we see it’s all zeros:

Single-stepping or jumping to line 121 to make the kernel initialize data array we see some new data:

|
It appears, at least at the time of writing this writeup, NVSE doesn’t support modifying global or shared memory: any attempt to change a byte value in the Memory window results in an error. However, since we start from a PTX listing we can make all the necessary memory adjustments in the source file. |
In this example we showed how Nsight Visual Studio Edition can be used to JIT-compile, load and debug the PTX code extracted from task’s binary cuCRACKME. Barring some initial setup, the workflow is typically the same as in the regular Visual Studio.
5. Analyzing GPU code
5.1 Preprocessing GPU code
Let us extract the PTX from task’s binary:
$ cuobjdump -ptx cuCRACKME > ptx.txtThe resulting file is quite large, which may look intimidating.
The PTX file starts with some basic architectural information, which is followed by two function declarations, four variable definitions, and a function definition:
.func _ZN3gpu1fEN18cooperative_groups4__v117thread_block_tileILj4EvEERNS_7block_tEb
(
.param .b64 _ZN3gpu1fEN18cooperative_groups4__v117thread_block_tileILj4EvEERNS_7block_tEb_param_0
)
;
.func _ZN3gpu2f_EN18cooperative_groups4__v117thread_block_tileILj4EvEER4dataILm4EES6_ib
(
.param .b64 _ZN3gpu2f_EN18cooperative_groups4__v117thread_block_tileILj4EvEER4dataILm4EES6_ib_param_0,
.param .b64 _ZN3gpu2f_EN18cooperative_groups4__v117thread_block_tileILj4EvEER4dataILm4EES6_ib_param_1,
.param .b32 _ZN3gpu2f_EN18cooperative_groups4__v117thread_block_tileILj4EvEER4dataILm4EES6_ib_param_2
)
;

.global .align 4 .b8 _ZZN3gpu2f_EN18cooperative_groups4__v117thread_block_tileILj4EvEER4dataILm4EES6_ibE8f_______[32] = {...};
.global .align 4 .b8 _ZZN3gpu2f_EN18cooperative_groups4__v117thread_block_tileILj4EvEER4dataILm4EES6_ibE6f_____[1024] = {...};
.global .align 8 .b8 _ZZN3gpu6kernelEPKNS_11gpu_input_tEPiE3f__[32] = {...};
.global .align 8 .b8 _ZZN3gpu6kernelEPKNS_11gpu_input_tEPiE4f___[32] = {...};

.visible .entry _ZN3gpu6kernelEPKNS_11gpu_input_tEPi(
.param .u64 _ZN3gpu6kernelEPKNS_11gpu_input_tEPi_param_0,
.param .u64 _ZN3gpu6kernelEPKNS_11gpu_input_tEPi_param_1
)
{
.reg .pred %p<4>;
.reg .b16 %rs<9>;
.reg .b32 %r<47>;
.reg .b64 %rd<29>;

        .shared .align 8 .b8 _ZZN3gpu6kernelEPKNS_11gpu_input_tEPiE4data[32];
...
To demangle we execute cu++filt and pass the mangled names to stdin or as a cmd line argument.
E.g. for the first function the output would be similar to the following:
_ZN3gpu1fEN18cooperative_groups4__v117thread_block_tileILj4EvEERNS_7block_tEb
gpu::f(cooperative_groups::__v1::thread_block_tile<(unsigned int)4, void>, gpu::block_t &, bool)
^C
Also note that the parameter names follow the same pattern:
{mangled_function_name}_param_{i}where i is the number of the parameter. For brevity, we remove the prefix and leave param_{i}.
Repeating this for every mangled name and replacing with the corresponding demangled ones, the PTX fragment listed above becomes somewhat more readable:
.func gpu::f(cooperative_groups::__v1::thread_block_tile<(unsigned int)4, void>, gpu::block_t &, bool)
(
.param .b64 param_0
)
;
.func gpu::f_(
                cooperative_groups::__v1::thread_block_tile<(unsigned int)4, void>,
                data<(unsigned long)4> &,
                data<(unsigned long)4> &,
                int,
                bool)
(
.param .b64 param_0,
.param .b64 param_1,
.param .b32 param_2
)
;
.global .align 4 .b8 gpu::f_(
                        cooperative_groups::__v1::thread_block_tile<(unsigned int)4, void>,
                        data<(unsigned long)4> &, data<(unsigned long)4> &, int, bool)
                        ::f_______[32] = {...};
.global .align 4 .b8 gpu::f_(
                        cooperative_groups::__v1::thread_block_tile<(unsigned int)4, void>,
                        data<(unsigned long)4> &, data<(unsigned long)4> &, int, bool)
                        ::f_____[1024] = {...};
.global .align 8 .b8 gpu::kernel(const gpu::gpu_input_t *, int *)::f__[32] = {...};
.global .align 8 .b8 gpu::kernel(const gpu::gpu_input_t *, int *)::f___[32] = {...};

.visible .entry gpu::kernel(const gpu::gpu_input_t *, int *)
(
.param .b64 param_0,
.param .b64 param_1
)
...
Processing the rest of the PTX file in a similar fashion we obtain a fairly comprehensible PTX code.
|
The demangled and annotated PTX code can be found in Notice that name demangling makes it kind of incorrect: it can’t be used to compile a cubin, nor can it be JIT-compiled and run using the launcher project To be able to debug the GPU code on PTX level and have the annotations visible (in VSE) during debugging, we created an additional PTX file |
5.2 Analyzing the function declarations
First, let’s examine the fragment of PTX shown in the previous section.
gpu::fFrom the demangled name of the function gpu::f it is clear it has three parameters:
-
cooperative_groups::__v1::thread_block_tile<(unsigned int)4, void>- a thread group of 4 threads -
gpu::block_t &- a pointer to a structure / class namedgpu::block_t -
bool- a boolean value.
However, examining the actual parameters list:
(
.param .b64 param_0
)
we see there is only one parameter of type .b64 left by the compiler.
Of the three parameters mentioned in the mangled name the second one, gpu::block_t &, is the most probable candidate for the user input (the kernel’s first argument gpu::gpu_input_t *) to be passed by, since we can assume it’s used to pass some data block for processing (as it’s the only pointer among the three parameters).
As to the other two parameters:
-
the first one,
thread_block_tile, was removed during compilation since the size of the thread group is constant, and it only tells the compiler which instructions to generate to synchronize the threads within a group -
most likely the third parameter,
bool, was the same for every functiongpu::fcall, so, effectively, it wasn’t a parameter, hence the compiler removed it as well.
Therefore, we deduce the actual function signature:
gpu::f(block_t &);gpu::f_Similarly, the demangled name of the second function, gpu::f_, shows there are five parameters:
-
cooperative_groups::__v1::thread_block_tile<(unsigned int)4, void>- a thread group of 4 threads -
data<(unsigned long)4> &- a pointer to a 4-byte data block -
data<(unsigned long)4> &- another pointer to a 4-byte data block -
int- a 4-byte integer value -
bool- a boolean value.
Then, examining the actual parameters list:
(
.param .b64 param_0,
.param .b64 param_1,
.param .b32 param_2
)
we see there are two .b64 and one .b32 parameters left by the compiler.
Again, most probably the two data block pointers and the integer are kept the parameters list, which gives the actual function signature:
gpu::f_(data<4> &, data<4> &, int);Studying the four variables definitions we can tell they are static variables defined within functions gpu::f_ and gpu::kernel, since their names contain prefixes gpu::f_(…):: and gpu::kernel(…)::, respectively.
We’ll return to these variables later.
gpu::kernelFinally, let’s take a look at the function gpu::kernel(const gpu::gpu_input_t *, int *).
From our analysis of the CPU part we know this is the kernel function that’s launched by cudaLaunchKernel (see Kernel launch). As such, this is the entry point to the GPU program (notice the annotation .entry that identifies gpu::kernel as the entry point).
|
We can verify that |
Recall that gpu::kernel is passed two arguments:
-
gpu::gpu_input_t *- a pointer to a structure / class that wraps 32-byte array that stores the user input fromstdinto be checked -
int *- a pointer to anintvariable that is used to return the result of the check.
Examining the actual parameters list we can verify it has two 8-byte parameters:
(
.param .b64 param_0,
.param .b64 param_1
)|
At this point we know the code defines two functions: which are executed by thread groups of size 4. The entry point is the function |
5.3 The kernel function
Let’s analyze the kernel code.
The kernel body starts with register allocations and declaration of a shared 32-byte buffer shared_data:
.reg .pred %p<4>;
.reg .b16 %rs<9>;
.reg .b32 %r<47>;
.reg .b64 %rd<29>;

.shared .align 8 .b8 shared_data[32];|
To make it easier to distinguish this shared buffer from similarly named objects (e.g. type
|
These allocations tell us that the kernel uses:
-
4 predicate registers for branching
-
9 16-bit registers
-
47 32-bit registers
-
29 64-bit registers.
We’ll see further that the 64-bit registers are usually used to represent pointers or thread indices in the grid.
|
Apparently, This circumstance has a clear advantage for us: whenever a register reappears in the listing, we know its value is the same as it was initialized to. |
Let’s examine the beginning of the kernel function:
ld.param.u64 %rd2, [param_0];
ld.param.u64 %rd3, [param_1];

cvta.to.global.u64 %rd1, %rd3;     // rd1 = param_1
mov.u32 %r7, %ctaid.z;             // r7 = blockIdx.z
mov.u32 %r8, %nctaid.y;            // r8 = gridDim.y
mul.wide.u32 %rd4, %r8, %r7;       // rd4 = blockIdx.z*gridDim.y
mov.u32 %r9, %nctaid.x;            // r9 = gridDim.x
cvt.u64.u32 %rd5, %r9;             // rd5 = gridDim.x
mov.u32 %r10, %ctaid.y;            // r10 =  blockIdx.y
cvt.u64.u32 %rd6, %r10;            // rd6 =  blockIdx.y
add.s64 %rd7, %rd4, %rd6;          // rd7 = blockIdx.z*gridDim.y + blockIdx.y
mul.lo.s64 %rd8, %rd7, %rd5;       // rd8 = gridDim.x*(blockIdx.z*gridDim.y + blockIdx.y)
mov.u32 %r11, %ctaid.x;
cvt.u64.u32 %rd9, %r11;            // rd9 = blockIdx.x
add.s64 %rd10, %rd8, %rd9;         // rd10= blockIdx.z*gridDim.x*gridDim.y +
;                                  //         blockIdx.y*gridDim.x + blockIdx.x
;                                  // rd10 - linear index of the thread block (BLOCK_RANK)
mov.u32 %r12, %ntid.y;             // r12 = blockDim.y
mov.u32 %r13, %ntid.x;             // r13 = blockDim.x
mul.lo.s32 %r14, %r13, %r12;       // r14 = blockDim.y*blockDim.x
mov.u32 %r15, %ntid.z;             // r15 = blockDim.z
mul.lo.s32 %r16, %r14, %r15;       // r16 = blockDim.y*blockDim.x*blockDim.z
;                                  // r16 - size of the thread block (BLOCK_SIZE)
cvt.u64.u32 %rd11, %r16;
mul.lo.s64 %rd12, %rd10, %rd11;    // rd12 = BLOCK_SIZE*BLOCK_RANK
mov.u32 %r17, %tid.z;              // r17 = threadIdx.z
mov.u32 %r18, %tid.y;              // r18 = threadIdx.y
mad.lo.s32 %r19, %r12, %r17, %r18; // r19 = threadIdx.z*blockDim.y+threadIdx.y
mov.u32 %r20, %tid.x;              // r20 = threadIdx.x
mad.lo.s32 %r21, %r19, %r13, %r20; // r21 = threadIdx.z*blockDim.x*blockDim.y +
;                                  //         threadIdx.y*blockDim.x+threadIdx.x;
;                                  // r12 - linear index of the thread within block
;                                  //         (BLOCK_THREAD_RANK)
cvt.u64.u32 %rd13, %r21;           // rd13 = BLOCK_THREAD_RANK
add.s64 %rd14, %rd12, %rd13;       // rd14 = BLOCK_SIZE*BLOCK_RANK +  BLOCK_THREAD_RANK
;                                  // rd14 - global linear index of the thread
;                                  //         (GLOBAL_THREAD_RANK)
bfe.u32 %r1, %r21, 2, 2;           // r1 = ((LOCAL_THREAD_RANK) & 0b1100) >> 2
;                                  // r1 - GROUP_RANK
and.b32 %r2, %r21, 3;              // r2 = (LOCAL_THREAD_RANK) & 0b11
;                                  // r2 - GROUP_THREAD_RANK
setp.gt.u64 %p1, %rd14, 15;        // p1 = GLOBAL_THREAD_RANK > 15;
@%p1 bra $L__BB0_4;
bra.uni $L__BB0_1;                 // if (GLOBAL_THREAD_RANK > 15)

$L__BB0_4:
ret;                               // return;
The kernel begins with loading values from the special registers that hold:
-
%nctaid- the grid dimensions -
%ctaid- the position of the thread block in the grid -
%ntid- the block dimensions -
%tid- the position of the thread in the block.
The goal of these operations is to determine the thread index of the current execution thread in the grid (GLOBAL_THREAD_RANK).
This is followed by bitwise shift and AND that may seem strange. But if we recall the declarations of gpu::f and gpu::f_:
.func gpu::f(cooperative_groups::__v1::thread_block_tile<(unsigned int)4, void>, gpu::block_t &, bool);
;
.func gpu::f_(cooperative_groups::__v1::thread_block_tile<(unsigned int)4, void>,
              data<(unsigned long)4> &,
              data<(unsigned long)4> &,
              int, bool);
we see the reference to thread groups of size 4. Therefore, this bitwise shift can be interpreted as computing the thread group index in the block (GROUP_RANK) and the position of the thread inside the group (GROUP_THREAD_RANK).
The first code snippet ends with a conditional branch, which terminates all threads with GLOBAL_THREAD_RANK > 15. At this point we may be certain that the kernel is executed by 16 threads divided into groups of 4.
The next code block makes the first thread of the first thread group zero out the integer value pointed by param_1:
$L__BB0_1:
or.b32 %r22, %r1, %r2;            // r22 = GROUP_RANK | GROUP_THREAD_RANK;
setp.ne.s32 %p2, %r22, 0;
@%p2 bra $L__BB0_3;               // if (GROUP_RANK == 0 && GROUP_THREAD_RANK == 0)
;                                 //   i.e. the first remaining thread

mov.u32 %r23, 0;
st.global.u32 [%rd1], %r23;       // *param_1 = 0

$L__BB0_3:

	mov.u32 %r24, %laneid;        // r24 = LANE_ID (thread id in the warp);  r24 in [0, 16]
	and.b32 %r30, %r24, -16;      // r30 = LANE_ID & (-16); r30 = 0;
mov.u32 %r31, 65535;              // r31 = 0xFFFF
shl.b32 %r32, %r31, %r30;         // r32 = r31 << r2; r31 = 0x00000FFFF;
;                                 // r32 - mask for all remaining threads (ALL_MASK)
bar.warp.sync %r32;               // BARRIER ALL
The purpose of the other part of the code block above is to compute the mask of the remaining threads and synchronize them. The %laneid register stores the index of the thread in the hardware group called warp. Since we only have 16 threads active, they all fall in one warp. Moreover, threads' %laneids must be consecutive.
|
This part could’ve been simpler, but the optimizer had failed to deduce that no more than 16 threads are alive at this moment. |
The next part reads the values of the user input (param_0), XORs them with the values stored in the static variable f__ and writes the result to the shared buffer:
mul.wide.u32 %rd15, %r1, 8;       // rd15 = GROUP_RANK*8
mov.u64 %rd16, gpu::kernel(const gpu::gpu_input_t *, int *)::f__;  // rd16 = &f__[0]
add.s64 %rd17, %rd16, %rd15;      // rd17 = &f__[0] + GROUP_RANK*8
cvt.u64.u32 %rd18, %r2;
add.s64 %rd19, %rd17, %rd18;
cvta.to.global.u64 %rd20, %rd2;   // rd20 = param_0;
add.s64 %rd21, %rd20, %rd15;
add.s64 %rd22, %rd21, %rd18;
ld.global.nc.u8 %rs1, [%rd22];    // rs1 = ((uint8_t*)param_0)[GROUP_RANK*8+GROUP_THREAD_RANK]
ld.global.nc.u8 %rs2, [%rd19];    // rs2 = ((uint8_t*)f__)[GROUP_RANK*8+GROUP_THREAD_RANK]
cvt.u16.u8 %rs3, %rs2;
xor.b16 %rs4, %rs1, %rs3;         // rs4 = rs1 ^ rs2
shl.b32 %r33, %r1, 3;             // rd33 = GROUP_RANK*8
mov.u32 %r34, shared_data;        // r34 = &shared_data[0]   (BUFFER_PTR)
add.s32 %r35, %r34, %r33;
add.s32 %r36, %r35, %r2;          // r36 = &BUFFER_PTR[GROUP_RANK*8+GROUP_THREAD_RANK]
st.shared.u8 [%r36], %rs4;        // BUFFER_PTR[GROUP_RANK*8+GROUP_THREAD_RANK] =
;                                 //   param_0[GROUP_RANK*8+GROUP_THREAD_RANK] ^
;                                 //   f__[GROUP_RANK*8+GROUP_THREAD_RANK];
ld.global.nc.u8 %rs5, [%rd22+4];
ld.global.nc.u8 %rs6, [%rd19+4];
cvt.u16.u8 %rs7, %rs6;
xor.b16 %rs8, %rs5, %rs7;
st.shared.u8 [%r36+4], %rs8;      // BUFFER_PTR[GROUP_RANK*8+GROUP_THREAD_RANK+4] =
;                                 //   param_0[GROUP_RANK*8+GROUP_THREAD_RANK+4] ^
;                                 //   f__[GROUP_RANK*8+GROUP_THREAD_RANK+4];

	mov.u32 %r25, %laneid;

	and.b32 %r37, %r25, -16;
shl.b32 %r38, %r31, %r37;
bar.warp.sync %r38;               // BARRIER ALL
After the transformation is done, all the active threads are synchronized.
Next, a pointer to an 8-byte block within the shared buffer is obtained and passed as a parameter to the function gpu::f:
{
    .reg .b64 %tmp;
    cvt.u64.u32 %tmp, %r34;
    cvta.shared.u64 %rd23, %tmp;
}
add.s64 %rd24, %rd23, %rd15;      // rd24 = BUFFER_PTR[GROUP_RANK*8]
{
	.reg .b32 temp_param_reg;
    .param .b64 param0;
    st.param.b64 [param0+0], %rd24;

    ; gpu::f(current_group, BUFFER_PTR[GROUP_RANK*8], ?)
    call.uni
    gpu::f(cooperative_groups::__v1::thread_block_tile<(unsigned int)4, void>, gpu::block_t &, bool),
    (
        param0
    );
}

mov.u32 %r28, %laneid;

and.b32 %r41, %r28, -16;
shl.b32 %r42, %r31, %r41;
bar.warp.sync %r42;               // BARRIER ALL
After the function call all threads are synchronized again.
Finally, the kernel compares the content of the static variable f___ with the content of the shared buffer:
mov.u64 %rd25, f___;
add.s64 %rd26, %rd25, %rd15;
ld.global.nc.u64 %rd27, [%rd26];   // rd27 = &f___[GROUP_RANK*8]
ld.shared.u64 %rd28, [%r35];
setp.ne.s64 %p3, %rd28, %rd27;
selp.u32 %r43, 1, 0, %p3;          // r43 = ((unsigned long long*)f___)[GROUP_RANK*8]
;                                  //       != ((unsigned long long*)shared_data)[GROUP_RANK*8]
atom.global.add.u32 %r44, [%rd1], %r43;  // atomicAdd(*param_1, r43)
;                                        // param_1 will be nonzero if f___ != shared_data

mov.u32 %r29, %laneid;

and.b32 %r45, %r29, -16;
shl.b32 %r46, %r31, %r45;
bar.warp.sync %r46;                // BARRIER ALL
ret;
}
The comparison result then added atomically to the value pointed to by param_1, which was zeroed at the beginning of the kernel. It means that the value *param_1 will remain 0 if and only if the user input, transformed by the function gpu::f, equals f___.
Therefore, the kernel function gpu::kernel mostly organizes the processing of the user input by calling the function gpu::f and comparing the transformed data with some hard-coded value. This is somewhat similar to the main function of the CPU part of the binary.
|
Note what we’ve found about the kernel function
|
5.4 The function gpu::f
The function gpu::f is actually quite simple - its body is just an unrolled loop followed by synchronization of the thread group. Let’s examine it:
.func gpu::f(cooperative_groups::__v1::thread_block_tile<(unsigned int)4, void>, gpu::block_t &, bool)(
    .param .b64 param_0       // DATA_PTR
)
{
.reg .b32 %r<36>;
.reg .b64 %rd<3>;

ld.param.u64 %rd1, [param_0]; // rd1 = DATA_PTR
add.s64 %rd2, %rd1, 4;        // rd2 = DATA_PTR + 4
mov.u32 %r2, 2;               // first 3 indexes of the unrolled loop
mov.u32 %r3, 1;               //   starting from the 4th invokation registers
mov.u32 %r4, 0;               //   r5-r33 are used to pass values 3-31
;                             // ===== the following is the unrolling of the loop =====
;                             // for(int i = 0; i < 32; ++i)
;                             //     gpu::f_(DATA_PTR, DATA_PTR + 4, i)
;                             // that is, this block is repeated 32 times
{
	.reg .b32 temp_param_reg;
    .param .b64 param0;
    st.param.b64 [param0+0], %rd1;
    .param .b64 param1;
    st.param.b64 [param1+0], %rd2;
    .param .b32 param2;
    st.param.b32 [param2+0], %r4;
    call.uni
    gpu::f_,
    (
        param0,               ; left half of the 8-byte block
        param1,               ; right half of the 8-byte block
        param2                ; i
    );
}
...

    mov.u32 %r1, %laneid;     // r1 = LANE_ID; r1 < 16 at this point

	and.b32 %r34, %r1, -4;    // r34 = LANE_ID % 4 (GROUP_RANK), GROUP_RANK in [0, 3]
shl.b32 %r35, %r17, %r34;     // r35 = 0xF << GROUP_THREAD_RANK; r17 was set to 15 above
bar.warp.sync %r35;           // BARRIER GROUP
ret;
The main point to note here is that in each of the 32 iterations of the loop the counter value is passed to the function gpu::f_ along with the pointers to data.
Also, we can see that an input 8-byte block is divided into two 4-byte blocks, which may or may not hint at a Feistel-type transformation being performed by the function gpu::f_.
|
Yes, we know such a conclusion is way too far-fetched, but |
|
Note what we’ve found about the function
|
5.5 The function gpu::f_
We saw in the previous section that the function gpu::f_ takes three arguments:
-
a pointer to the left 4-byte half of a data block (call it
DATA_LOW_PTR) -
a pointer to the right 4-byte half of a data block (call it
DATA_HIGH_PTR) -
an iteration index (
COUNTER).
.func gpu::f_(
                cooperative_groups::__v1::thread_block_tile<(unsigned int)4, void>,
                data<(unsigned long)4> &,
                data<(unsigned long)4> &,
                int,
                bool)
(
    .param .b64 param_0,  ; DATA_LOW_PTR
    .param .b64 param_1,  ; DATA_HIGH_PTR
    .param .b32 param_2   ; COUNTER
)
Since there are 32 iterations of the unrolled loop, COUNTER takes values from [0, 32).
The first code block computes the position of the thread within the thread group and reads the value of the input data blocks:
ld.param.u64 %rd3, [param_0]; // rd3 = DATA_LOW_PTR
ld.param.u64 %rd2, [param_1]; // rd2 = DATA_HIGH_PTR
ld.param.u32 %r3, [param_2];  // r3  = COUNTER
mov.u32 %r5, %ntid.y;
mov.u32 %r6, %tid.z;
mov.u32 %r7, %tid.y;
mad.lo.s32 %r8, %r5, %r6, %r7;
mov.u32 %r9, %ntid.x;
mov.u32 %r10, %tid.x;
mad.lo.s32 %r11, %r8, %r9, %r10;

and.b32 %r12, %r11, 3;        // r12 = GROUP_THREAD_RANK
{ .reg .b64 %tmp;
cvta.to.shared.u64 %tmp, %rd3;
cvt.u32.u64 %r2, %tmp; }      // r2 = DATA_LOW_PTR
cvt.u64.u32 %rd1, %r12;       // rd1 = GROUP_THREAD_RANK
add.s32 %r1, %r2, %r12;       // r1 = &DATA_LOW_PTR[GROUP_THREAD_RANK]
ld.shared.u8 %rs1, [%r1];     // rs1 = (uint8_t)DATA_LOW_PTR[GROUP_THREAD_RANK]
;                             // rs1 - stores the initial value of the lower half (OLD_LOW)

	mov.u32 %r4, %laneid;

	and.b32 %r13, %r4, -4;
mov.u32 %r14, 15;
shl.b32 %r15, %r14, %r13;
bar.warp.sync %r15;           // BARRIER GROUP
The code block ends with synchronization of the thread group.
The next code block is executed only by the first thread of the group:
setp.ne.s32 %p1, %r12, 0;     // if (GROUP_THREAD_RANK == 0)
@%p1 bra $L__BB2_2;

; ======================================================
; we know that COUNTER is in [0, 31]
; the following lines should be examined keeping that in mind

shr.s32 %r16, %r3, 31;        // r16 = 0
shr.u32 %r17, %r16, 29;       // r17 = 0
add.s32 %r18, %r3, %r17;      // r18 = COUNTER;
and.b32 %r19, %r18, -8;       // r19 = COUNTER & (-8); r19 in [0, 8, 16, 24]
sub.s32 %r20, %r19, %r3;      // r20 = r19 - COUNTER = -(COUNTER %8);
add.s32 %r21, %r20, 7;        // r21 = 7 - COUNTER % 8;
mul.wide.s32 %rd4, %r21, 4;   // rd4 = r21*4;
mov.u64 %rd5, f_______;
add.s64 %rd6, %rd5, %rd4;     // rd6 = (uint32_t*)f_______ + (7 - COUNTER % 8)
ld.shared.u32 %r22, [%r2];
ld.global.nc.u32 %r23, [%rd6];
add.s32 %r24, %r22, %r23;     // r24 = ((unt32_t*)f_______)[7 - COUNTER % 8] + *DATA_LOW_PTR

st.shared.u32 [%r2], %r24;    // *DATA_LOW_PTR += ((uint32_t*)f_______)[7 - COUNTER % 8]
;
;                             // ; end if
$L__BB2_2:
	cvt.u32.u64 %r27, %rd1;
	mov.u32 %r25, %laneid;

	and.b32 %r28, %r25, -4;
shl.b32 %r30, %r14, %r28;
bar.warp.sync %r30;           // BARRIER GROUP
It looks like the first thread fetches the value from the static variable f_______ and then arithmetically adds it to the lower part of the data block, DATA_LOW_PTR.
Since f_______ is not used anywhere but here, meaning we don’t see any other interpretations of the stored data, we can assume that it is an array of eight 4-byte integers. These 4-byte integers are fetched in reverse order. Since the COUNTER value can be up to 31, its value is taken modulo 8.
The code block ends with a thread block barrier.
Next, we see a substitution table being used:
shl.b64 %rd7, %rd1, 8;         // rd7 = GROUP_THREAD_RANK << 8; rd7 in (0, 256, 512, 768)
mov.u64 %rd8, f_____;
add.s64 %rd9, %rd8, %rd7;      // rd9 = &f_____[GROUP_THREAD_RANK << 8]
ld.shared.u8 %rd10, [%r1];     // rd10 = DATA_LOW_PTR[GROUP_THREAD_RANK]
add.s64 %rd11, %rd9, %rd10;

ld.global.nc.u8 %rs2, [%rd11]; // rs2 = *(uint8_t*)(&f_____[GROUP_THREAD_RANK << 8]
;                              //                    +    DATA_LOW_PTR[GROUP_THREAD_RANK]]);
cvt.u16.u8 %rs3, %rs2;
st.shared.u8 [%r1], %rs3;      // DATA_LOW_PTR[GROUP_THREAD_RANK] =
;                              //        f_____[GROUP_THREAD_RANK << 8 + DATA_LOW_PTR[GROUP_THREAD_RANK]]

	mov.u32 %r26, %laneid;

	and.b32 %r31, %r26, -4;
shl.b32 %r32, %r14, %r31;
bar.warp.sync %r32;             // BARRIER GROUP
The static variable f_____ looks like a set of four substitution tables - one for each byte of the lower half of the input data block DATA_LOW_PTR.
The index of the table to be used, which is also the index of the byte to be substituted, is calculated as GROUP_THREAD_RANK << 8.
The new value for this byte is the value stored in the corresponding S-box at position given by the current value of the byte: f_____[GROUP_THREAD_RANK << 8 + DATA_LOW_PTR[GROUP_THREAD_RANK]].
As always, the snippet ends with a thread block barrier.
The next code block is executed only by the first thread of the group. A circular left shift is performed, followed by a barrier:
setp.ne.s32 %p2, %r27, 0;            // p2 = GROUP_THREAD_RANK != 0
@%p2 bra $L__BB2_4;                  // if GROUP_THREAD_RANK == 0

ld.shared.u32 %r33, [%r2];           //
shf.l.wrap.b32 %r34, %r33, %r33, 11; // cyclic shift left
st.shared.u32 [%r2], %r34;           // *(uint32_t*)DATA_LOW_PTR = *(uint32_t)DATA_LOW_PTR <<< 11;

;                                    // end if
$L__BB2_4:

	mov.u32 %r35, %laneid;

	and.b32 %r38, %r35, -4;
mov.u32 %r39, 15;
shl.b32 %r40, %r39, %r38;
bar.warp.sync %r40;                  // BARRIER GROUP
Finally, the last part of the function gpu::f_ XORs and swaps the low and high parts of the input data block (the swap is skipped on the last iteration):
{ .reg .b64 %tmp;
cvta.to.shared.u64 %tmp, %rd2;
cvt.u32.u64 %r41, %tmp; }
add.s32 %r42, %r41, %r27;        // r42 = &DATA_HIGH_PTR[GROUP_THREAD_RANK]
ld.shared.u8 %rs4, [%r1];
ld.shared.u8 %rs5, [%r42];
xor.b16 %rs6, %rs4, %rs5;        // rs6 = DATA_HIGH_PTR[GROUP_THREAD_RANK] ^ DATA_LOW_PTR[GROUP_THREAD_RANK]
;                                // rs6 <- NEW_LOW
setp.lt.s32 %p3, %r3, 31;        // p3 = COUNTER == 31
selp.b16 %rs7, %rs1, %rs6, %p3;  //
selp.b16 %rs8, %rs6, %rs1, %p3;  //
st.shared.u8 [%r42], %rs7;       // DATA_LOW_PTR = (COUNTER == 31) ? OLD_LOW : NEW_LOW
st.shared.u8 [%r1], %rs8;        // DATA_HIGH_PTR = (COUNTER == 31) ? NEW_LOW : OLD_LOW

	mov.u32 %r36, %laneid;

	and.b32 %r43, %r36, -4;
shl.b32 %r44, %r39, %r43;
bar.warp.sync %r44;               // BARRIER GROUP
ret;
The function ends with synchronization of the thread group.
|
Note what we’ve found about the function
This is clearly a Feistel structure, so we can assume |
|
What’s important regarding this function being a Feistel function is that in order to reverse it we only need to change the order of the addends (the round keys). |
5.6 Summary
Putting it all together, the GPU part of cuCRACKME encrypts the user input using Feistel-like block cipher with 8-bytes block, 32 rounds, and hard-coded round keys. Encryption is done in the ECB mode.
The 32-byte user input is passed to the GPU kernel function gpu::kernel. The kernel is executed by 16 threads grouped into 4 thread blocks. Each thread block processes an 8-byte data block of the input.
Essentially, the processing comprises the following steps:
-
the user input is
XORed with a constant mask stored in the static arrayf__ -
the masked user input is split into four 8-byte blocks and processed independently using function
gpu::f -
gpu::fcalls what appears to be a round functiongpu:f_32 times to encrypt an 8-byte block using some Feistel cipher -
the result is compared to the hard-coded value stored in the array
f___.
The round function gpu::f_ performs the following:
-
arithmetic addition of the left half of the block and a round key stored in the array
f_______ -
non-linear transformation of the left subblock based on the four S-boxes stored in the variable
f_____ -
circular shift of the left subblock 11 bits to the left
-
XORing and swapping of the block halves.
The processing is summarized in the following cpp-esque semi-pseudocode:
uint8_t  f__[32] = {...};          // the mask
uint8_t  f___[32] = {...};         // the correct result
uint8_t  f_____[4 * 256] = {...};  // the four SBOXes
uint32_t f_______[8] = {...};     // the round keys

uint8_t  shared_data[32] = {0};


void gpu::kernel(uint8_t* user_input, int* result) {
    *result = 0;

    // 1. masking
    for (int i = 0; i < 32; ++i)
        shared_data[i] = user_input[i] ^ f__[i];

    // 2. encryption
    gpu::f(&shared_data[0]);
    gpu::f(&shared_data[8]);
    gpu::f(&shared_data[16]);
    gpu::f(&shared_data[24]);

    // 3. checking the result
    for (int i = 0; i < 32; ++i)
        *result += shared_data[i] != f___[i];
}

void gpu::f(uint8_t* block) {
    for (int i = 0; i < 32; ++i)
        gpu::f_((uint32_t*)block, (uint32_t*)(block + 4), i);
}

void gpu::f_(uint32_t* DATA_LOW_PTR, uint32_t* DATA_HIGH_PTR, int COUNTER) {
    uint32_t OLD_LOW = *DATA_LOW_PTR;

    // 1. addition with a round key from f_______
    *DATA_LOW_PTR += f_______[7 - COUNTER % 8];

    // 2. substitutions
    ((uint8_t*)DATA_LOW_PTR)[0] = f_____[0 << 8 + ((uint8_t*)DATA_LOW_PTR)[0]];
    ((uint8_t*)DATA_LOW_PTR)[1] = f_____[1 << 8 + ((uint8_t*)DATA_LOW_PTR)[1]];
    ((uint8_t*)DATA_LOW_PTR)[2] = f_____[2 << 8 + ((uint8_t*)DATA_LOW_PTR)[2]];
    ((uint8_t*)DATA_LOW_PTR)[3] = f_____[3 << 8 + ((uint8_t*)DATA_LOW_PTR)[3]];

    // 3. rotation left by 11
    *DATA_LOW_PTR = (*DATA_LOW_PTR << 11) | (*DATA_LOW_PTR >> 11);

    // 4. XORing the halves and swapping (except the last iteration)
    uint32_t NEW_LOW = *DATA_HIGH_PTR ^ *DATA_LOW_PTR;
    *DATA_LOW_PTR = (COUNTER == 31) ? OLD_LOW : NEW_LOW;
    *DATA_HIGH_PTR = (COUNTER == 31) ? NEW_LOW : OLD_LOW;
}|
The cipher implemented in the task’s binary is actually Magma cipher [1] with reversed round key order and modified substitution tables. However, we don’t need to identify the Feistel cipher, as reversing the order of the round keys allows us to use the same function for decryption. |
6. Solving and getting the flag
Based on our findings, the task’s solution boils down to:
-
extracting the hard-coded ciphertext - the static array
f___ -
passing this ciphertext through an inversion of
gpu::f -
XORing the decrypted data with the arrayf__to unmask the flag.
Since the cipher implemented in cuCRACKME is a Feistel network, inverting gpu::f only requires changing the order of the round keys.
In the following sections several solutions are presented. The first one shows that simple static analysis is enough to reverse engineer and implement the decryption program, the next two solutions are based on debugging and, essentially, only require overwriting a couple of memory buffers.
6.1 Implementing the solution
Our analysis of the binary’s GPU part showed that the round function gpu::f_ performs four simple operations, and the cipher function gpu::f is merely a cycle that calls gpu::f_. Hence, it is fairly easy to implement these two functions.
With gpu::f and gpu::f_ implemented we only need to:
-
extract the hard-coded arrays from the PTX code (the ciphertext
f___, the SBOXesf_____, the maskf__, and the round keysf_______) -
change the order of the keys either by modifying the indexing during the round keys array accessing, or simply by shuffling the keys in the array
f_______ -
input the ciphertext
f___togpu::f -
unmask the decrypted flag.
The solution CPP program is shown below (the full source can be found in solution/reversed/reversed.cpp):
uint8_t f_______[32] = {/* taken from the PTX */};
uint8_t f_____[1024] = {/* taken from the PTX */};
uint8_t f__[32] = {/* taken from the PTX */};
uint8_t f___[32] = {/* taken from the PTX */};

union half_block {
    uint8_t bytes[4];
    uint32_t uint;
};

union block {
    uint64_t ulong;
    struct {
        half_block lo, hi;
    };
};

union input_t {
    block blocks[4];
    char string[sizeof(blocks)];
};


void f_(half_block &lo, half_block &hi, int counter) {
    auto copy = lo.uint;
    auto key = ((uint32_t *) f_______)[counter % 8];      (1)
    lo.uint += key;
    for (int i = 0; i < 4; ++i) {
        const uint8_t *table = &f_____[i << 8];
        lo.bytes[i] = table[lo.bytes[i]];
    }
    lo.uint = lo.uint << 11 | lo.uint >> 21;
    auto tmp = lo.uint ^ hi.uint;
    bool last_round = counter == 31;
    (last_round ? hi.uint : lo.uint) = tmp;
    (last_round ? lo.uint : hi.uint) = copy;
}


int main() {
    auto input = *(input_t *) f___;
    for (int i = 0; i < 4; ++i) {
        auto &b = input.blocks[i];
        for (int j = 0; j < 32; ++j)
            f_(b.lo, b.hi, j);
        b.ulong ^= ((input_t *) f__)->blocks[i].ulong;    (2)
    }

    std::cout << std::string_view{input.string, sizeof(input)} << std::endl;
}| 1 | the round keys order is reversed (in the binary the indexing was 7 - (round % 8)) |
| 2 | the decrypted block is XORed with the mask f__ |
Compiling and executing the solution we get the flag:
$ cd solution/reversed
$ mkdir build && cd build
$ cmake ..

# on Linux
$ make
$ ./cucrackme_reversed
VolgaCTF{bd26a64925a1a217adf8e5}

# on Windows
$ msbuild cucrackme_reversed.sln
$ Debug\cucrackme_reversed.exe
VolgaCTF{bd26a64925a1a217adf8e5}
The flag is: VolgaCTF{bd26a64925a1a217adf8e5}.
|
Albeit not as simple a solution as the next one, the clear advantage of reverse engineering is that it doesn’t require a CUDA-capable GPU, since all the analysis can be done statically (see 5. Analyzing GPU code) and the solution source file is fully self-contained. |
6.2 Debugging the binary
Solving cuCRACKME task becomes especially easy with a CUDA-capable GPU device at hand.
Recall that to solve the task we need to turn gpu::f into a decryption function by reversing the order of the round keys f_______. Luckily, all the static arrays, including f_______, are stored in the global memory and, therefore, can be modified on run time.
To reverse the order of the keys we split the 32-byte array into eight 4-byte parts and reverse their order, so that the original array
f_______[32] = {
    144, 152, 103, 155,    25,  26,  62, 173,    41, 191, 197, 114,   254, 248,   7, 236,
    170, 160, 134, 190,   154, 205,  42, 231,   105,  37, 249, 163,    50, 179, 120, 173};
becomes
f_______[32] = {
     50, 179, 120, 173,   105,  37, 249, 163,   154, 205,  42, 231,   170, 160, 134, 190,
    254, 248,   7, 236,    41, 191, 197, 114,    25,  26,  62, 173,   144, 152, 103, 155};
The solution comprises the following steps:
-
start debugging
cuCRACKMEon Ubuntu 22.04 machine usingcuda-gdb(debugging is discussed in 4.5.1 SASS-level debugging) -
input any 32-byte string and break on the kernel launch
-
set a breakpoint right before the call to
gpu::f -
resume execution and modify two arrays when the breakpoint is hit:
-
overwrite the round keys array
f_______with the reversed keys array shown above -
write 32 bytes of the encrypted flag
f___to the shared buffer
-
-
set a breakpoint on return from the kernel and resume execution
-
extract the decrypted data from the shared buffer
-
the decrypted data is actually the masked flag, so the last step is to
XORit with the maskf__to get the flag.
An example debugging session implementing this solution is shown below.
$ cuda-gdb -q cuCRACKME
Reading symbols from cuCRACKME...
(No debugging symbols found in cuCRACKME)
(cuda-gdb) set cuda break_on_launch application                             (1)
(cuda-gdb) set print asm-demangle on
(cuda-gdb) run
Starting program: /opt/cuCRACKME
[Thread debugging using libthread_db enabled]
Using host libthread_db library "/lib/x86_64-linux-gnu/libthread_db.so.1".
Gimme ye kee!
ABCDEFGHIJKLMNOPQRSTUVWXYZABCDEF                                            (2)
[New Thread 0x7ffff52c7000 (LWP 81015)]
[Detaching after fork from child process 81016]
[New Thread 0x7fffe9fff000 (LWP 81023)]
[New Thread 0x7fffe97fe000 (LWP 81024)]
[New Thread 0x7fffe8ffd000 (LWP 81025)]
[Switching focus to CUDA kernel 0, grid 1, block (0,0,0), thread (0,0,0), device 0, sm 0, warp 0, lane 0]
0x00007fffe3258100 in gpu::kernel(gpu::gpu_input_t const*, int*)<<<(1,1,1),(32,1,1)>>> ()
(cuda-gdb) info cuda devices
  Dev PCI Bus/Dev ID                       Name Description SM Type SMs Warps/SM Lanes/Warp Max Regs/Lane      Active SMs Mask
*   0        01:01.0 NVIDIA GeForce RTX 2080 Ti     TU102-A   sm_75  68       32         32           255 0x000000000000000001                                                    (3)
(cuda-gdb) disas
Dump of assembler code for function _ZN3gpu6kernelEPKNS_11gpu_input_tEPi:
=> 0x00007fffe3258100 <+0>:     IMAD.MOV.U32 R1, RZ, RZ, c[0x0][0x28]
   ...
--Type <RET> for more, q to quit, c to continue without paging--
   ...
   0x00007fffe3258490 <+912>:   NOP
   0x00007fffe32584a0 <+928>:   NOP
   0x00007fffe32584b0 <+944>:   CALL.REL.NOINC 0x5a0                        (4)
   0x00007fffe32584c0 <+960>:   UMOV UR6, 0x0
   0x00007fffe32584d0 <+976>:   NOP
   ...
--Type <RET> for more, q to quit, c to continue without paging-- q
Quit
(cuda-gdb) b *0x7fffe32584b0                                                (4)
Breakpoint 1 at 0x7fffe32584b0
(cuda-gdb) c                                                                (4)
Continuing.

Thread 1 "cuCRACKME" hit Breakpoint 1, 0x00007fffe32584b0 in gpu::kernel(gpu::gpu_input_t const*, int*)<<<(1,1,1),(32,1,1)>>> ()
(cuda-gdb) p &_ZZN3gpu2f_EN18cooperative_groups4__v117thread_block_tileILj4EvEER4dataILm4EES6_ibE8f_______
$1 = (<data variable, no debug info> *) 0x7fffc7e00000                      (5)
(cuda-gdb) x/32bu (@global void *) 0x7fffc7e00000
0x7fffc7e00000: 144     152     103     155     25      26      62      173
0x7fffc7e00008: 41      191     197     114     254     248     7       236
0x7fffc7e00010: 170     160     134     190     154     205     42      231
0x7fffc7e00018: 105     37      249     163     50      179     120     173
(cuda-gdb) set *(@global uint8_t [32] *) 0x7fffc7e00000 = { \               (5)
    50, 179, 120, 173,   105,  37, 249, 163,   154, 205,  42, 231,   170, 160, 134, 190, \
    254, 248,   7, 236,    41, 191, 197, 114,    25,  26,  62, 173,   144, 152, 103, 155}
(cuda-gdb) x/32bu (@global void *) 0x7fffc7e00000
0x7fffc7e00000: 50      179     120     173     105     37      249     163
0x7fffc7e00008: 154     205     42      231     170     160     134     190
0x7fffc7e00010: 254     248     7       236     41      191     197     114
0x7fffc7e00018: 25      26      62      173     144     152     103     155
(cuda-gdb)
(cuda-gdb) x/32bu (@shared void *) 0x0
0x0:    205     85      97      21      28      139     203     129
0x8:    158     6       110     87      163     215     42      17
0x10:   180     250     140     46      116     76      13      202
0x18:   61      48      147     105     114     177     99      248
(cuda-gdb) p &_ZZN3gpu6kernelEPKNS_11gpu_input_tEPiE4f___                   (6)
$2 = (<data variable, no debug info> *) 0x7fffc7e00600
(cuda-gdb) p/u *((@global uint8_t *) 0x7fffc7e00600)@32                     (6)
$3 = {164, 144, 24, 181, 54, 43, 150, 51, 173, 108, 159, 91, 67, 50, 104, 67, 156, 245, 236, 200, 77, 210, 196, 211, 2, 16, 237, 113, 133, 201, 211, 213}
(cuda-gdb) set *(@shared uint8_t [32] *) 0x0 = { \                          (6)
    164, 144, 24, 181, 54, 43, 150, 51, 173, 108, 159, 91, 67, 50, 104, 67, \
    156, 245, 236, 200, 77, 210, 196, 211, 2, 16, 237, 113, 133, 201, 211, 213}
(cuda-gdb) x/32bu (@shared void *) 0x0
0x0:    164     144     24      181     54      43      150     51
0x8:    173     108     159     91      67      50      104     67
0x10:   156     245     236     200     77      210     196     211
0x18:   2       16      237     113     133     201     211     213
(cuda-gdb)
(cuda-gdb) disas
Dump of assembler code for function _ZN3gpu6kernelEPKNS_11gpu_input_tEPi:
   ...
--Type <RET> for more, q to quit, c to continue without paging--
   ...
   0x00007fffe32584a0 <+928>:   NOP
=> 0x00007fffe32584b0 <+944>:   CALL.REL.NOINC 0x5a0
   0x00007fffe32584c0 <+960>:   UMOV UR6, 0x0
   ...
--Type <RET> for more, q to quit, c to continue without paging--
   0x00007fffe32585d0 <+1232>:  IMAD.IADD R3, R4, 0x1, R3
   ...
   0x00007fffe3258670 <+1392>:  @P0 RED.E.ADD.STRONG.GPU [UR4], R7
   0x00007fffe3258680 <+1408>:  NOP
   0x00007fffe3258690 <+1424>:  EXIT                                        (7)
   0x00007fffe32586a0 <+0>:     IADD3 R9, R2, 0x4, RZ
   0x00007fffe32586b0 <+16>:    IMAD.MOV.U32 R12, RZ, RZ, R2
   ...
(cuda-gdb) b *0x7fffe3258690                                                (7)
Breakpoint 2 at 0x7fffe3258690
(cuda-gdb) c                                                                (7)
Continuing.

Thread 1 "cuCRACKME" hit Breakpoint 2, 0x00007fffe3258690 in gpu::kernel(gpu::gpu_input_t const*, int*)<<<(1,1,1),(32,1,1)>>> ()
(cuda-gdb) p/u *((@shared uint8_t *) 0x0)@32                                (8)
$4 = {218, 120, 78, 54, 56, 142, 216, 143, 172, 46, 65, 41, 216, 248, 83, 117, 220, 154, 234, 27, 16, 123, 104, 163, 83, 11, 182, 77, 9, 144, 19, 195}
(cuda-gdb) p &_ZZN3gpu6kernelEPKNS_11gpu_input_tEPiE3f__
$5 = (<data variable, no debug info> *) 0x7fffc7e00500
(cuda-gdb) p/u *((@global uint8_t *)0x7fffc7e00500)@32                      (8)
$6 = {140, 23, 34, 81, 89, 205, 140, 201, 215, 76, 37, 27, 238, 153, 101, 65, 229, 168, 223, 122, 33, 26, 90, 146, 100, 106, 210, 43, 49, 245, 38, 190}
(cuda-gdb) quit| 1 | cuda-gdb is requested to break execution on the kernel launch |
| 2 | a 32-byte string is input (any 32-byte string would do) |
| 3 | debugging is done on GeForce RTX 2080 Ti |
| 4 | a breakpoint is set on the address of gpu::f call instruction and execution is resumed |
| 5 | the round keys array is overwritten with the reversed keys array |
| 6 | the encrypted flag is copied to the shared buffer to be passed to gpu::f (with the keys reversed it acts like a decryption function) |
| 7 | a breakpoint is set on the exit instruction of the kernel and execution is resumed |
| 8 | 32 bytes of the shared buffer along with the mask array f__ are examined; note that at this point the shared buffer contains the masked flag |
Having found the decrypted masked flag what’s left is to XOR it with the mask array f__ to get the flag:
$ python3 -c "\
decrypted = [218, 120, 78, 54, 56, 142, 216, 143, 172, 46, 65, 41, 216, 248, 83, 117, 220, 154, 234, 27, 16, 123, 104, 163, 83, 11, 182, 77, 9, 144, 19, 195]; \
mask = [140, 23, 34, 81, 89, 205, 140, 201, 215, 76, 37, 27, 238, 153, 101, 65, 229, 168, 223, 122, 33, 26, 90, 146, 100, 106, 210, 43, 49, 245, 38, 190]; \
print('\nThe flag: %s' % bytes([a^b for a,b in zip(decrypted, mask)]).decode())"

The flag: VolgaCTF{bd26a64925a1a217adf8e5}
The flag is: VolgaCTF{bd26a64925a1a217adf8e5}.
|
As discussed in the beginning of Example2. Debugging For instance, in the SASS generated for
As can be seen, the offsets and the instructions differ. However, that’s the only difference we need to concern ourselves with, as all the other steps remain the same. Therefore, it should be possible to solve the task on CUDA-capable GPUs other than |
|
To summarize the solution and make it easier to repeat it, here are the necessary input commands extracted from the debugging session shown in the example: Keep in mind that the addresses (and even the SASS, see the discussion above) are likely to differ in different environments. |
6.3 Patching the binary’s PTX
Provided there’s a CUDA-capable GPU device and a PTX launcher project similar to solution/launch_ptx, the task could be solved via patching the binary’s PTX code and debugging it on a Windows machine using Nsight Visual Studio Edition (see 4.5.2 PTX-level debugging).
As NVSE doesn’t seem to support writing to memory (see this comment), the idea is to make all the necessary memory changes to a PTX file extracted from the task’s binary cuCRACKME, launch this patched PTX breaking on the last instruction of the kernel, and extract the decrypted flag from the shared buffer.
Concretely, since overwriting the shared buffer is not an option, the encrypted flag stored in the global array _ZZN3gpu6kernelEPKNS_11gpu_input_tEPiE4f___ must be passed as the 32-byte input string to the kernel function gpu::kernel. But that’s not enough, for the user input is XORed with the mask _ZZN3gpu6kernelEPKNS_11gpu_input_tEPiE3f__ prior to being passed to the encryption function gpu::f. Therefore, we have to either pre-XOR the encrypted flag before calling the kernel, or simply zero-out the mask array rendering this masking ineffective.
The easiest way to pass _ZZN3gpu6kernelEPKNS_11gpu_input_tEPiE4f___ to the kernel function is to hard-code it in the launcher main function, so that it’s used whenever the input string is not explicitly given in the command line arguments (see lines 128-152 in solution/launch_ptx/launch_ptx.cpp).
Zeroing the mask array is trivial:
// :SOLUTION:
// these bytes are XORed with the user input
// to avoid preXORing the hardcoded value to mitigate this masking we can simply replace the array with zeros
// .global .align 8 .b8 _ZZN3gpu6kernelEPKNS_11gpu_input_tEPiE3f__[32] = {140, 23, 34, 81, 89, 205, 140, 201, 215, 76, 37, 27, 238, 153, 101, 65, 229, 168, 223, 122, 33, 26, 90, 146, 100, 106, 210, 43, 49, 245, 38, 190};
.global .align 8 .b8 _ZZN3gpu6kernelEPKNS_11gpu_input_tEPiE3f__[32] = {0, 0, 0, 0, 0, 0, 0, 0, 0, 0, 0, 0, 0, 0, 0, 0, 0, 0, 0, 0, 0, 0, 0, 0, 0, 0, 0, 0, 0, 0, 0, 0};
As to reversing the round keys, the idea remains the same: the original array _ZZN3gpu2f_EN18cooperative_groups4__v117thread_block_tileILj4EvEER4dataILm4EES6_ibE8f_______ must be changed to the reversed keys array:
// :SOLUTION:
// this array stores the round keys - eight 4-byte values
// we need to reverse the order of these keys so that the first key becomes the last one
// .global .align 4 .b8 _ZZN3gpu2f_EN18cooperative_groups4__v117thread_block_tileILj4EvEER4dataILm4EES6_ibE8f_______[32] = {144, 152, 103, 155, 25, 26, 62, 173, 41, 191, 197, 114, 254, 248, 7, 236, 170, 160, 134, 190, 154, 205, 42, 231, 105, 37, 249, 163, 50, 179, 120, 173};
.global .align 4 .b8 _ZZN3gpu2f_EN18cooperative_groups4__v117thread_block_tileILj4EvEER4dataILm4EES6_ibE8f_______[32] = {50, 179, 120, 173, 105, 37, 249, 163, 154, 205, 42, 231, 170, 160, 134, 190, 254, 248, 7, 236, 41, 191, 197, 114, 25, 26, 62, 173, 144, 152, 103, 155};
The patched PTX code can be found in solution/ptx_patched.ptx, where the modified parts are marked with :SOLUTION: comments.
With the patched PTX code solving the task is easy:
-
set up the NVSE as shown in Example 3. Debugging
cuCRACKMEusing Nsight Visual Studio Edition -
make sure the Command Arguments contain a single argument: a path to the PTX file
ptx_patched.ptx(navigate to Debug > launch_ptx Debug Properties, select Debugging view, remove the"ABC…DEF"string and changeptx_original.ptxtoptx_patched.ptx) -
start debugging
cuCRACKMEand break on the kernel launch -
set a breakpoint on line 177 and resume execution:

-
when the breakpoint is hit examine the shared buffer array by evaluating address expression
(@shared int*) 0x0in any Memory window: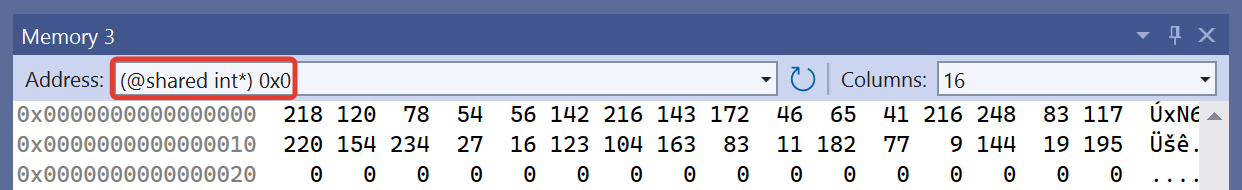
which gives us the masked flag.
Finally, XORing the decrypted data with the mask _ZZN3gpu6kernelEPKNS_11gpu_input_tEPiE3f__:
$ python3 -c "\
decrypted = [218, 120, 78, 54, 56, 142, 216, 143, 172, 46, 65, 41, 216, 248, 83, 117, 220, 154, 234, 27, 16, 123, 104, 163, 83, 11, 182, 77, 9, 144, 19, 195]; \
mask = [140, 23, 34, 81, 89, 205, 140, 201, 215, 76, 37, 27, 238, 153, 101, 65, 229, 168, 223, 122, 33, 26, 90, 146, 100, 106, 210, 43, 49, 245, 38, 190]; \
print('\nThe flag: %s' % bytes([a^b for a,b in zip(decrypted, mask)]).decode())"

The flag: VolgaCTF{bd26a64925a1a217adf8e5}
we get the flag: VolgaCTF{bd26a64925a1a217adf8e5}.
|
It is possible to make this solution fully automated, so that the decrypted and unmasked flag is output by the launcher program, and debugging is not necessary. This requires a couple of changes:
The reader is challenged to implement these changes. |
|
The PTX extracted from Recall that Along with the compiled code every cubin may store several data ranges. The global arrays are stored in the section named Therefore, should the task’s binary be run on a GPU with compute capability 5.2, the CUDA runtime will execute the cubin stored in Examining section
Summing it up, yet another way to solve the task boils down to patching the round keys and mask arrays in the cubin and debugging the patched binary on a GPU with compute capability 5.2 (e.g. |
7. Conclusion
While this document is a writeup for VolgaCTF 2024 Quals task called cuCRACKME, the large part of it is devoted to CUDA platform and toolchain overview, as, arguably, the task’s difficulty stems from the not-so-exotic yet unusual CUDA platform being used.
Hopefully, the basic information presented in section 4 and the references below would help an interested reader to delve deeper into reverse engineering and debugging CUDA binaries.
References
-
[10] Zhang, Xiuxia, et al. "Understanding the GPU microarchitecture to achieve bare-metal performance tuning." Proceedings of the 22nd ACM SIGPLAN Symposium on Principles and Practice of Parallel Programming. 2017. link
-
[11] Jia, Zhe, et al. "Dissecting the NVIDIA volta GPU architecture via microbenchmarking." arXiv preprint arXiv:1804.06826 (2018). link
-
[12] Jia, Zhe, et al. "Dissecting the nvidia turing t4 gpu via microbenchmarking." arXiv preprint arXiv:1903.07486 (2019). link
-
[13] Abdelkhalik, Hamdy, et al. "Demystifying the nvidia ampere architecture through microbenchmarking and instruction-level analysis." 2022 IEEE High Performance Extreme Computing Conference (HPEC). IEEE, 2022. link
-
[14] Hayes, Ari B., et al. "Decoding CUDA binary." 2019 IEEE/ACM International Symposium on Code Generation and Optimization (CGO). IEEE, 2019. link
-
[15] Hayes, Ari B., et al. "Decoding CUDA binary - decoded instructions," 2019. link
-
[16] Hayes, Ari B., et al. "Decoding CUDA binary - file format," 2019. link
-
[17] Hayes, Ari B. A GPU binary analysis framework for memory performance and safety. Diss. Rutgers The State University of New Jersey, School of Graduate Studies, 2022. link
-
[18] Hayes, Ari B., et al. A framework for analysis and transformation of assembly code
-
[21] CUDA Compilation
-
[25] CUDA-GDB
-
[29] NVBit: A Dynamic Binary Instrumentation Framework for NVIDIA GPUs
-
[34] CUDA Toolkit
-
[35] CUDA Samples: ptxjit