
February 3, 2014
Dollar Cost Averaging

Lately, the stock market has been doing well, but is it necessary for the stock market to soar in order for your portfolio to grow? In this issue we look at a strategy called Dollar Cost Averaging, which can be used to build a college fund portfolio, or any long-term investment.
When you purchase stock, your money is used to purchase shares in the company, based on the current stock price.
For example, suppose you purchase $1000 of Google stock (GOOG) on January 2, 2014. This is the number of shares you purchased (source: Yahoo Finance).
\[ \text{GOOG Price/Share: } \$1{,}180.97 \] \[ \text{Number of shares purchased} = \frac{\$1000}{\$1{,}180.97} \approx 0.846 \]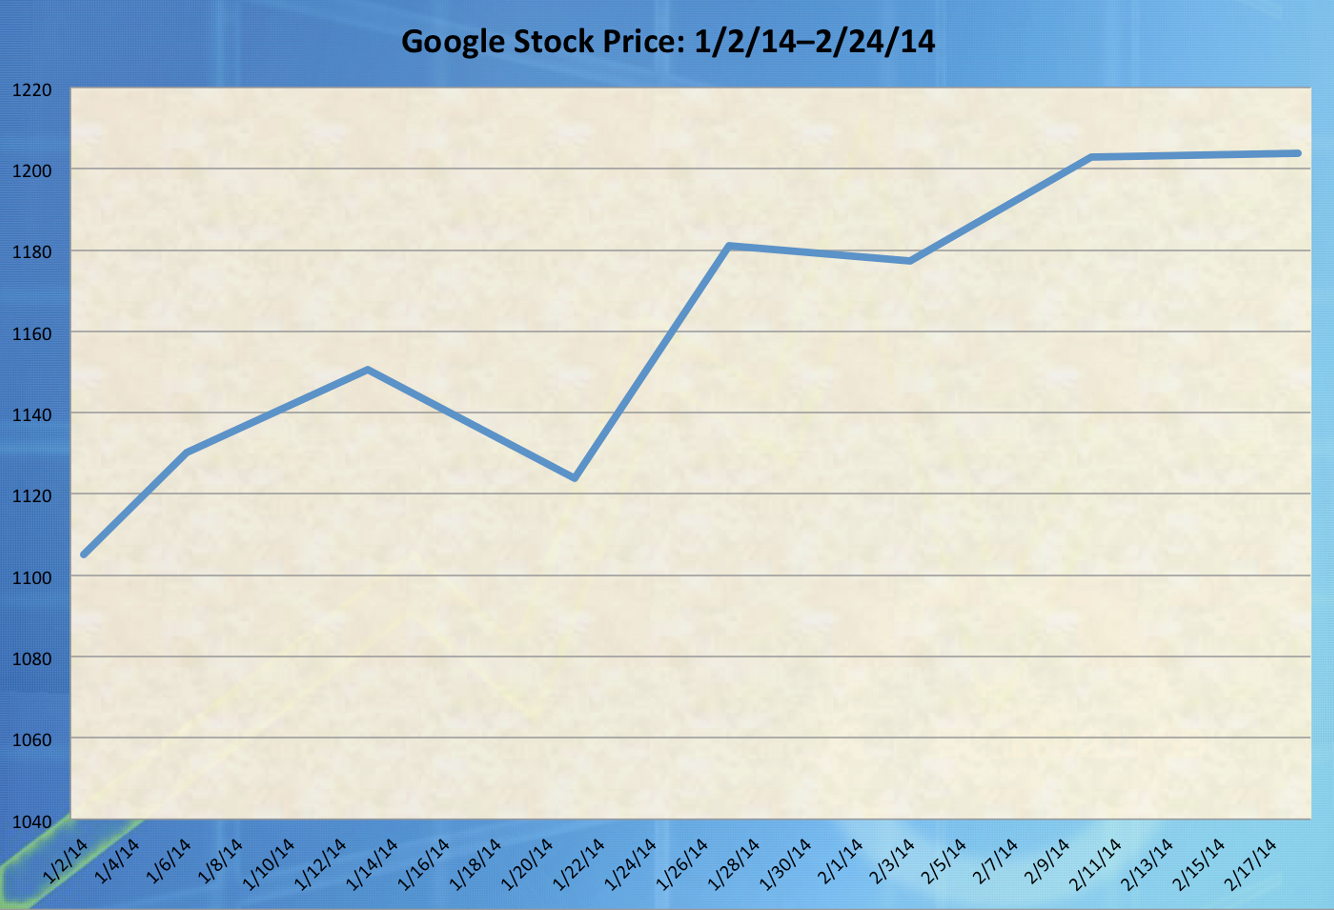
As the price of Google’s stock changes, the value of your shares changes, too.
Dollar Cost Averaging
Dollar Cost Averaging is a method of purchasing stocks over a long period of time, allowing you to increase your investment with a low-risk investment strategy.
Here’s how Dollar Cost Averaging works:
Purchase a set amount of a certain stock every month. This can be set up as an automatic payment from a bank account. Regardless of price fluctuations in the stock, continue purchasing the set amount each month.
Over time, in spite of the ups and downs in the stock, the value of your stock holdings will continue to grow. The key is to identify a stock of a company that will continue to grow over the period of your investment. The safest strategy is to pick companies with long track records of growth (Coke, IBM, etc.).
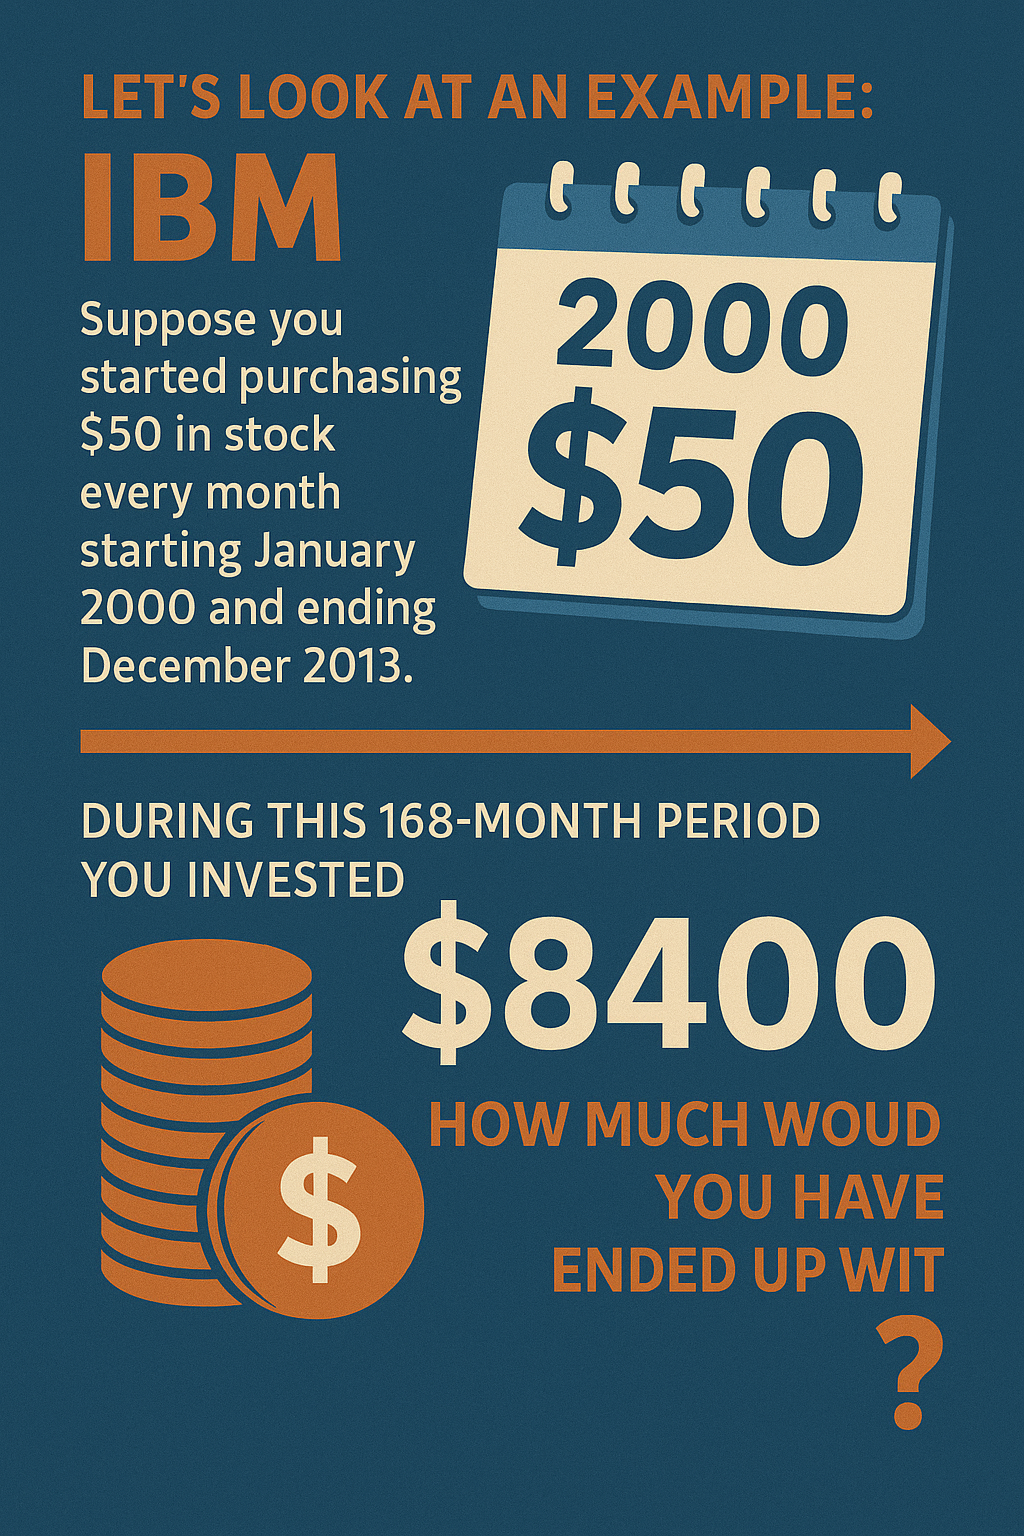
Let’s look at an example: IBM. Suppose you started purchasing $50 in stock every month starting January 2000 and ending December 2013. During this 168-month period you invested $8400. How much would you have ended up with?
We’ll run a simulation showing Dollar Cost Averaging purchases of stocks over this 168-month period. Most stock Web sites have historical data on the price of a stock. We’ll be using data from Yahoo Finance, part of which is shown in this spreadsheet. (The data can be downloaded as a spreadsheet from Yahoo Finance.)
| Date | Price |
|---|---|
| 1/3/00 | \$93.47 |
| 2/1/00 | \$85.65 |
| 3/1/00 | \$98.67 |
| 4/3/00 | \$92.95 |
| 5/1/00 | \$89.56 |
| 6/1/00 | \$91.44 |
| 7/3/00 | \$93.69 |
| 8/1/00 | \$110.31 |
| 9/1/00 | \$94.10 |
| 10/2/00 | \$82.30 |
| 11/1/00 | \$78.22 |
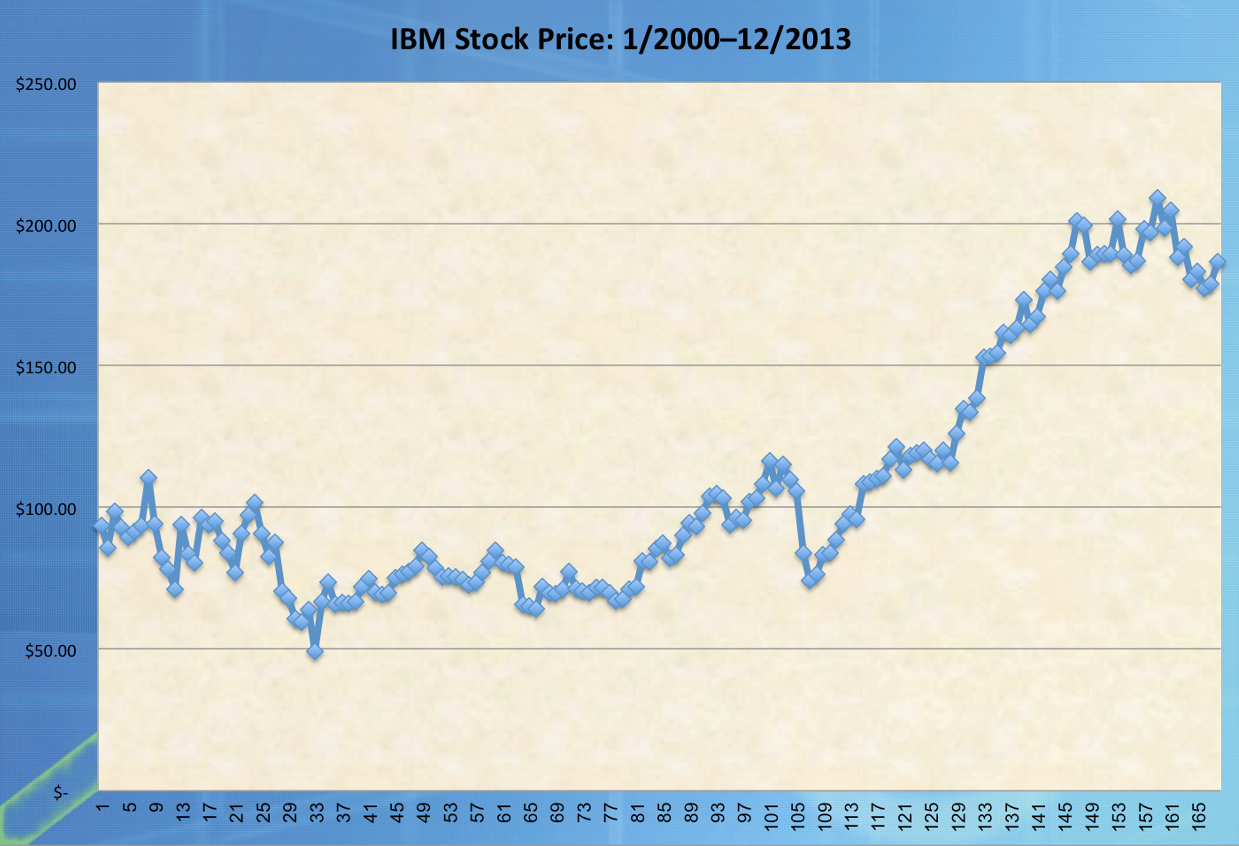
Create a line graph of the stock price data. Notice that although there are a lot of fluctuations, the stock price grew during the investment period.
| Date | Price | Shares Purchased |
|---|---|---|
| 1/3/00 | \$93.47 | 0.5349 |
| 2/1/00 | \$85.65 | 0.5838 |
| 3/1/00 | \$98.67 | 0.5067 |
| 4/3/00 | \$92.95 | 0.5379 |
| 5/1/00 | \$89.56 | 0.5583 |
| 6/1/00 | \$91.44 | 0.5468 |
| 7/3/00 | \$93.69 | 0.5337 |
| 8/1/00 | \$110.31 | 0.4533 |
Add a column that shows the number of shares purchased each month. Simply divide the \$50 by the share price for that month. Here is some of the data.
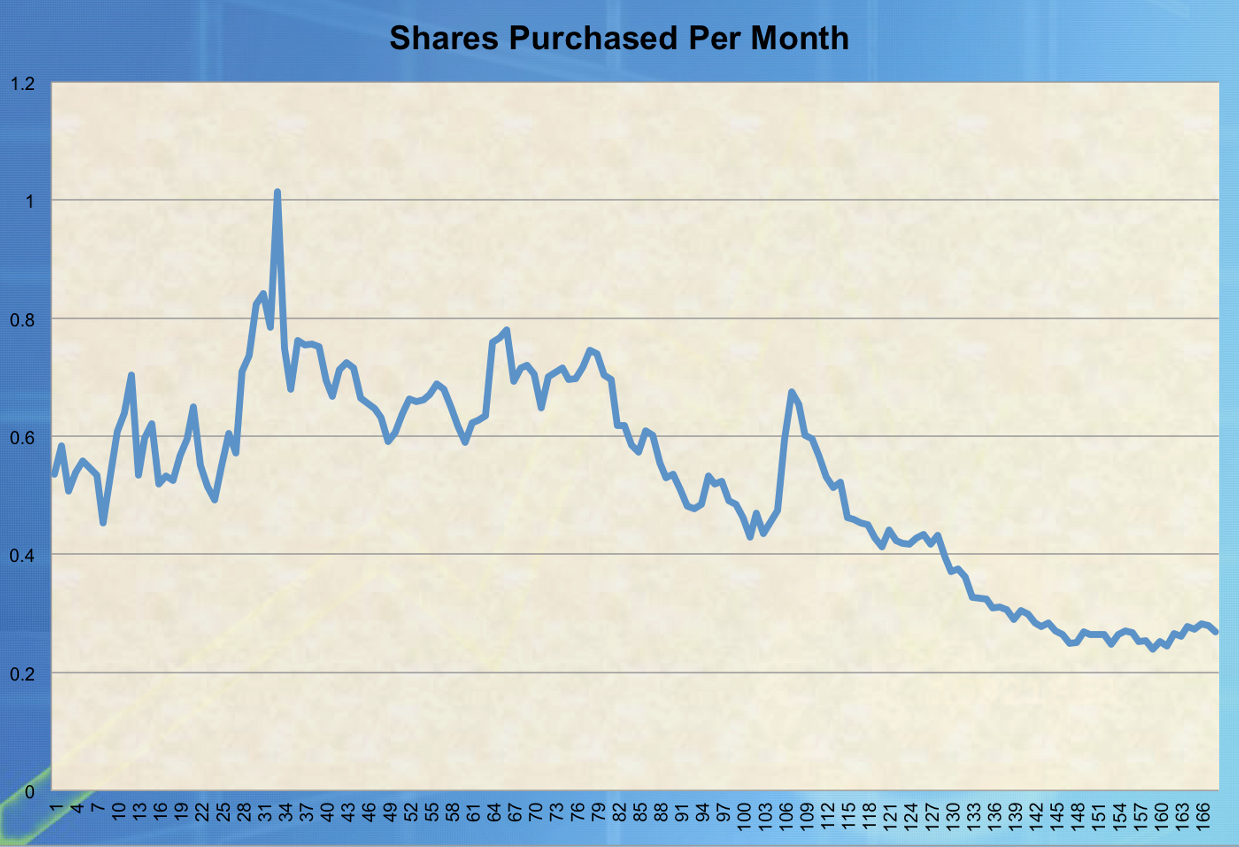
Create a line graph of the share purchase data. Notice that as the stock price increases, fewer shares are purchased. Also, when the stock dips in price, more shares are purchased.
| Date | Price | Shares Purchased | Cumulative Value |
|---|---|---|---|
| 1/3/00 | \$93.47 | 0.5349 | \$50.00 |
| 2/1/00 | \$85.65 | 0.5838 | \$95.82 |
| 3/1/00 | \$98.67 | 0.5067 | \$160.38 |
| 4/3/00 | \$92.95 | 0.5379 | \$201.08 |
| 5/1/00 | \$89.56 | 0.5583 | \$243.75 |
| 6/1/00 | \$91.44 | 0.5468 | \$298.87 |
| 7/3/00 | \$93.69 | 0.5337 | \$356.22 |
| 8/1/00 | \$110.31 | 0.4533 | \$469.41 |
Now add a fourth column to find the cumulative value of your stock month in and month out. Note the type of formula you should use in this column. After the 168-month period, the stock value is over \$16,000.
Spreadsheet Formula = SUM( \$D\$2 :D3 ) * C3
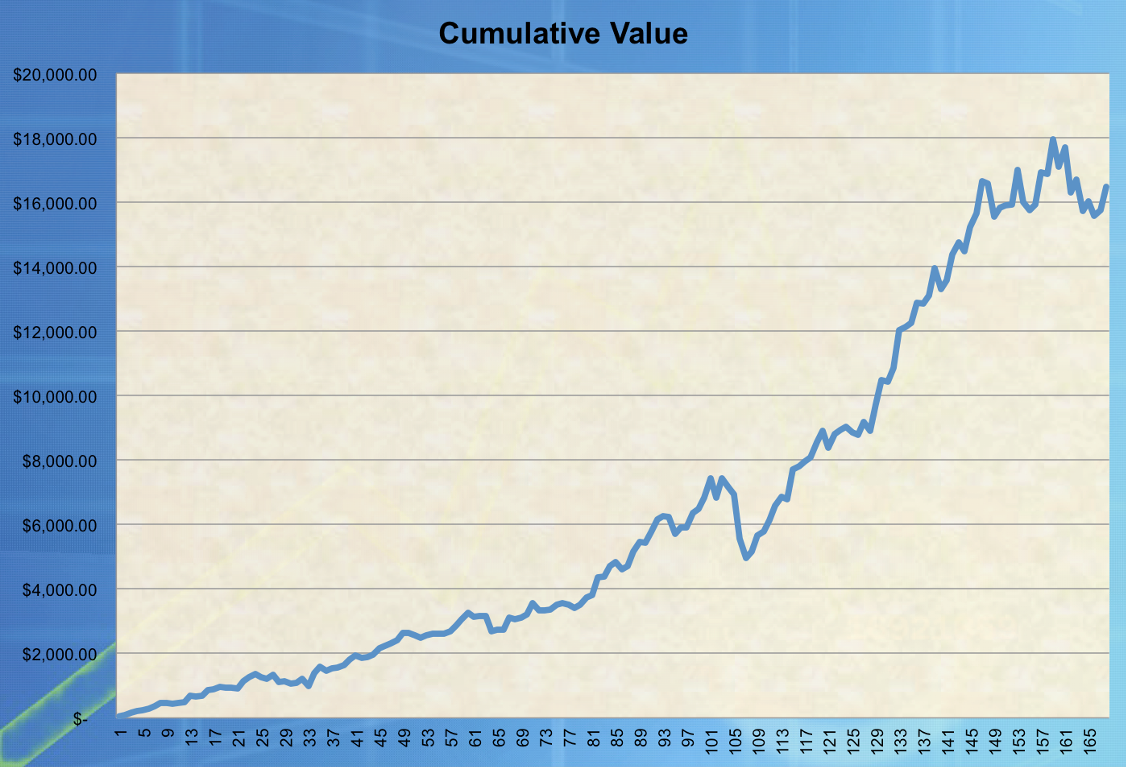
Here is a graph of the cumulative value of your stock purchases. It’s similar to the stock price graph shown earlier. The Dollar Cost Averaging strategy aligns itself with the overall performance of the stock.
Save your spreadsheet and try a different data set for a company that didn’t grow during this period: JC Penney. Simply replace the data in column B with the new data.
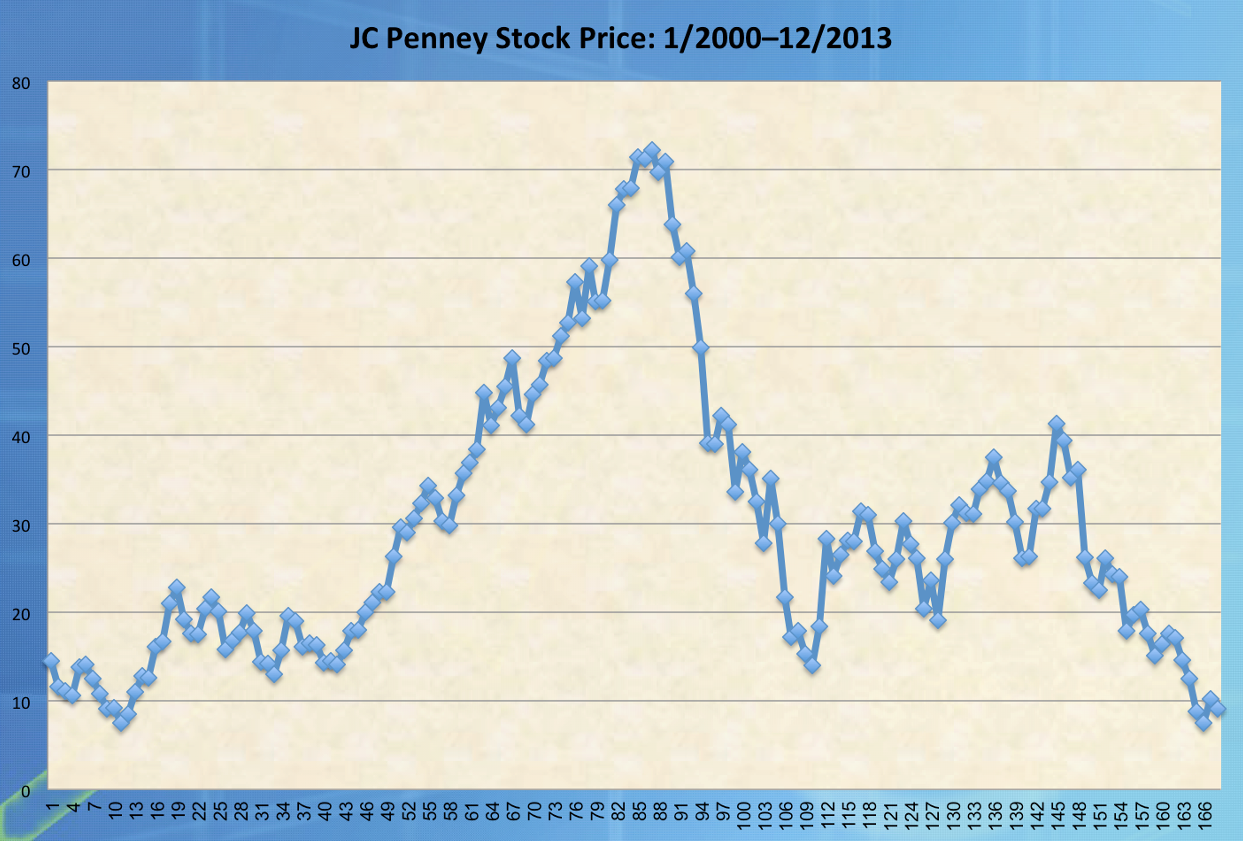
Here is the stock performance graph. As you can see, this stock went into a decline that it still hasn’t emerged from.
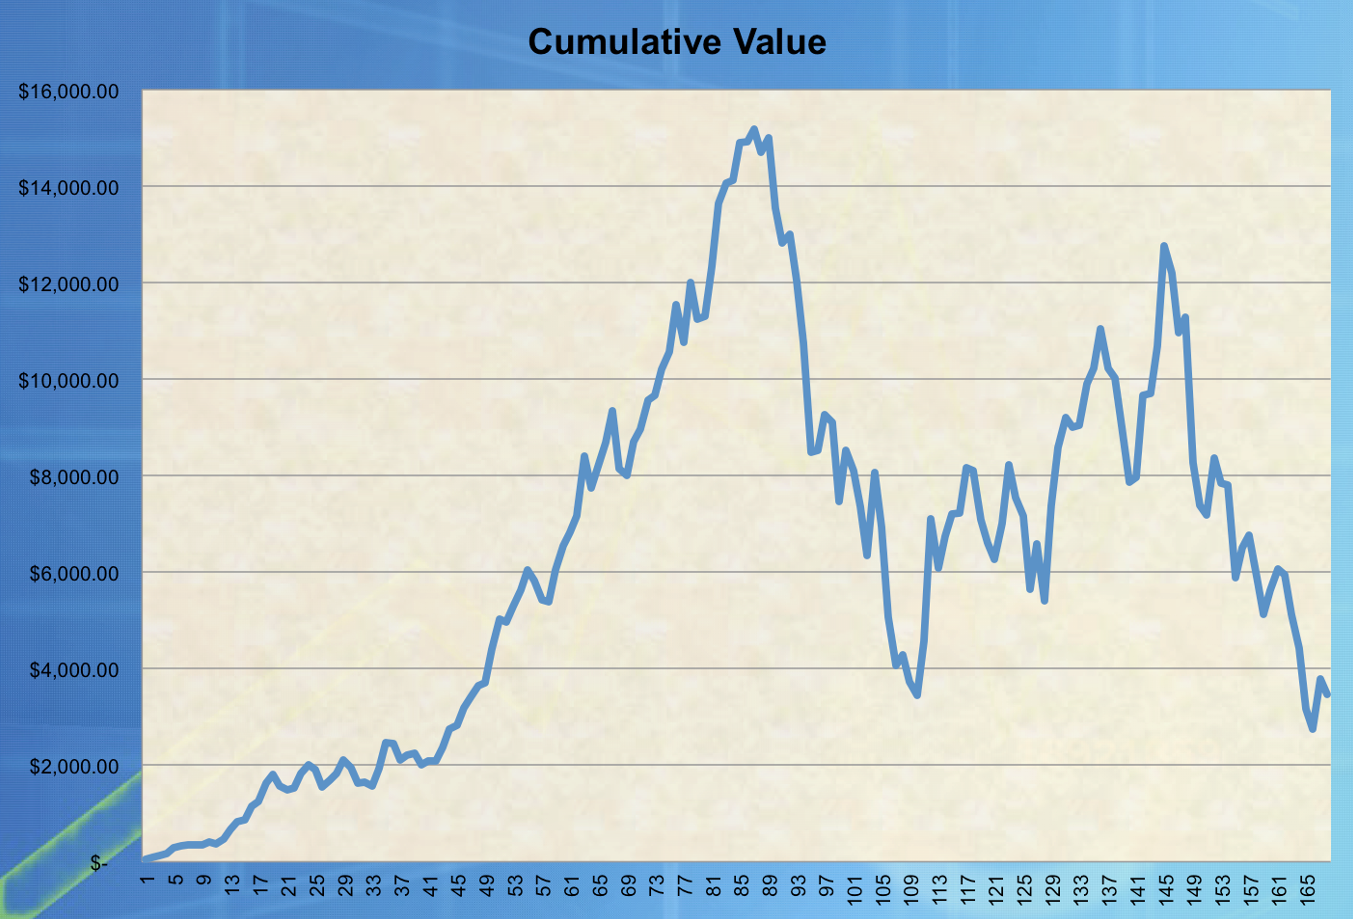
As a result, a Dollar Cost Averaging approach with this stock would have resulted in less value after 168 months.
The key with Dollar Cost Averaging is to find companies that will continue to show growth, or to know when it’s time to divest from a company that is losing stock value.
Worked Example
Suppose the price of Google stock is \$1,180.97. If you invest \$1000 at this price, how many shares can you purchase?
Here is the math:
\[
\text{GOOG Price/Share: } \$1{,}180.97
\]
\[
\text{Number of shares purchased} = \frac{\$1000}{\$1{,}180.97} \approx 0.846
\]
Think About It
- What are the advantages of Dollar Cost Averaging over a one-time lump sum investment?
- Why is it important to research the long-term performance of a stock before using this strategy?
- How does this investment strategy help reduce risk?
- Can Dollar Cost Averaging still be effective in a declining market?
- How might you apply this strategy outside of investing—for example, in budgeting or savings plans?
Watch and Learn
This short video explains how Dollar Cost Averaging works and why it's considered one of the most effective long-term investment strategies. It illustrates how consistent investing can smooth out market volatility and help build wealth over time.
Video available online: https://www.youtube.com/watch?v=uI0GDnclz4k