February 2012
Gas Data
The price of gasoline is going up with various predictions of what the price will be. How can we get a handle on what the price might be in the future? In this issue we look at data from U.S. Dept. of Energy. We analyze historical data for the average price of gasoline from 1990 to the present. In the process we look at various regression models that can be used to predict the future price of gasoline.
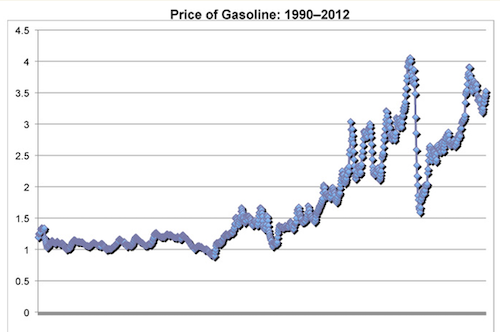
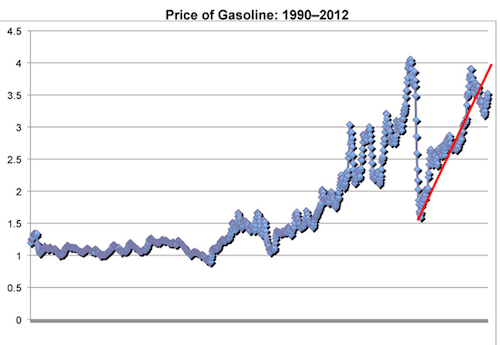
This graph shows the average price of gasoline from 1990 to 2/20/12. This is a large data set that you can download from this site:
http://www.eia.gov/petroleum/gasdiesel/
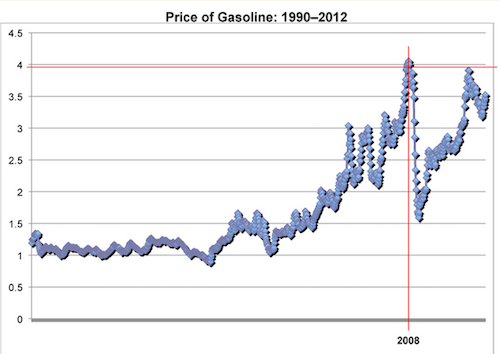
Notice that there was a previous spike in the price of gasoline in 2008, which led to a steep drop in price. Currently, we are on the upswing in price since that downward spike.
Data Analysis
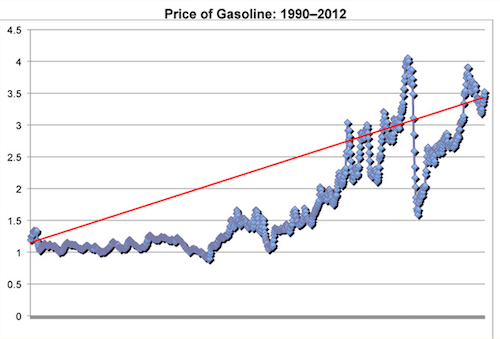
There is an overall linear regression that could be performed on this large data set. But such a linear model would not capture some of the near-term changes in price.
Instead, it makes more sense to look at a linear regression for this part of the overall data set.
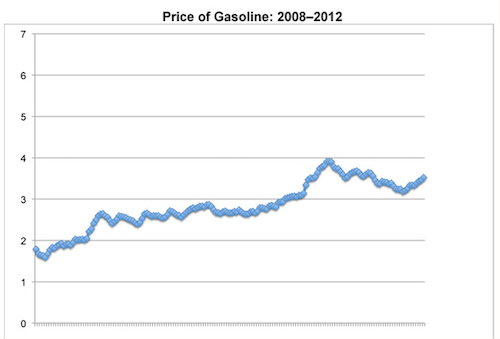
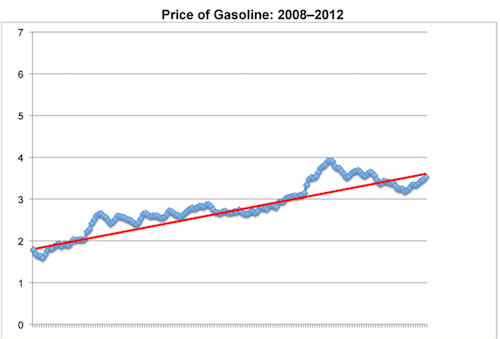
Here is the graph of this portion of the data, which covers the period from 2008 (when the gas dipped to its lowest) to the present.
This will result in a better line of best fit.
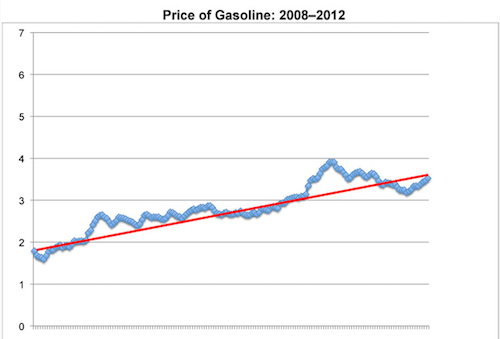
Running a linear regression on this data set results in this equation for the line of best fit.
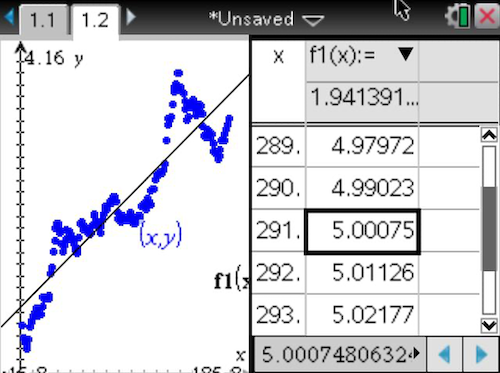
Using the equation, we can find the estimated time when the price of gasoline will, on average, be $5.
According to this regression, it would take till 2015 for that to happen. But given current pricing trends, that date is too far off.
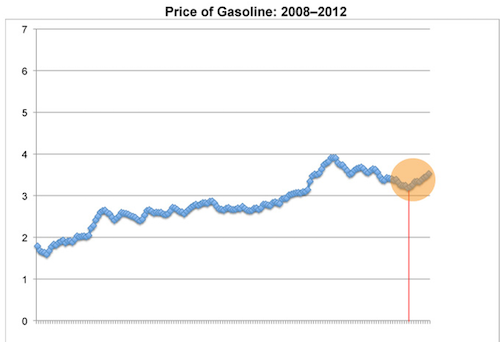
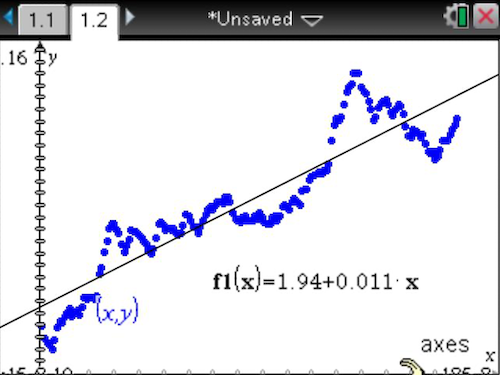
The most recent data shows a bigger spike than the overall trend. This portion of the data takes us to 2010, and perhaps a linear regression on this portion of the data will yield a better estimate.
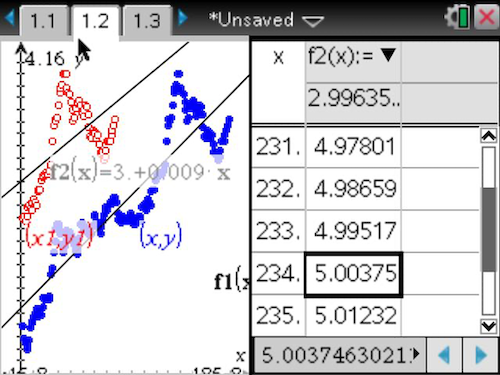
The newer regression curve does, indeed, show gas approaching $5 at a faster rate.
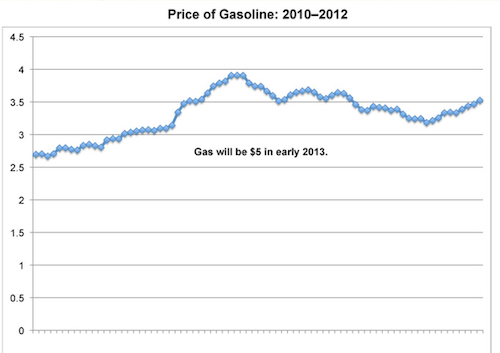
With this regression curve, the price of gasoline will reach $5 by the end of this year, into early 2013.
When do you think the price of gas will reach $5 per gallon in your area? When do you think the average for the country will be $5 per gallon?
Think About It
- What variables do you think affect the price of gasoline the most?
- How accurate do you think linear regression is for modeling volatile prices?
- What events could disrupt these projections?
- How might different regions experience these price changes differently?
- How would you explain this data trend to someone skeptical of mathematical modeling?
Video Demonstration: Regression in Excel
Want to see how regression equations for gas prices are calculated? This video walks through running a linear regression in Excel using real oil and gas data—mirroring the analysis we used in this issue.