Cis-to-trans ratio is computed as the ratio of long-range cis reads (>20kb) to trans reads plus long-range cis reads. Typically, cis-to-trans ratio higher than 40% is required. Percentage of long-range cis reads is the ratio of long-range cis reads to total number of reads. Minimum 15% is required and 40% or higher suggests a good library[1]. Convergence is determined as standard deviation of proportions of four read orientations to be <0.002 (Very good) or <0.05 (Good) (See below section Proportion of read orientation versus genomic separation). The slope of log10 contact probability vs distance between 10kb ~ 300kb representing TAD is also provided as well. (See below section Contact probability versus genomic separation.)
Table 1. Summary Table
| QC field | GM12878_Rao_subset | K562_Rao | test |
|---|---|---|---|
| Total reads | 651,962 | 1,037,949,819 | 59,792 |
| Short cis reads (<20kb) | 221,017 | 228,633,660 | 15,406 |
| Cis reads (>20kb) | 276,411 | 517,776,704 | 28,668 |
| Trans reads | 154,534 | 291,539,455 | 15,718 |
| Cis/Trans ratio | 64.141 | 63.977 | 64.588 |
| % Long-range intrachromosomal reads | 42.397 | 49.885 | 47.946 |
| convergence | Good | Very Good | Not converged |
| slope | -0.95 | -0.8 | -0.76 |
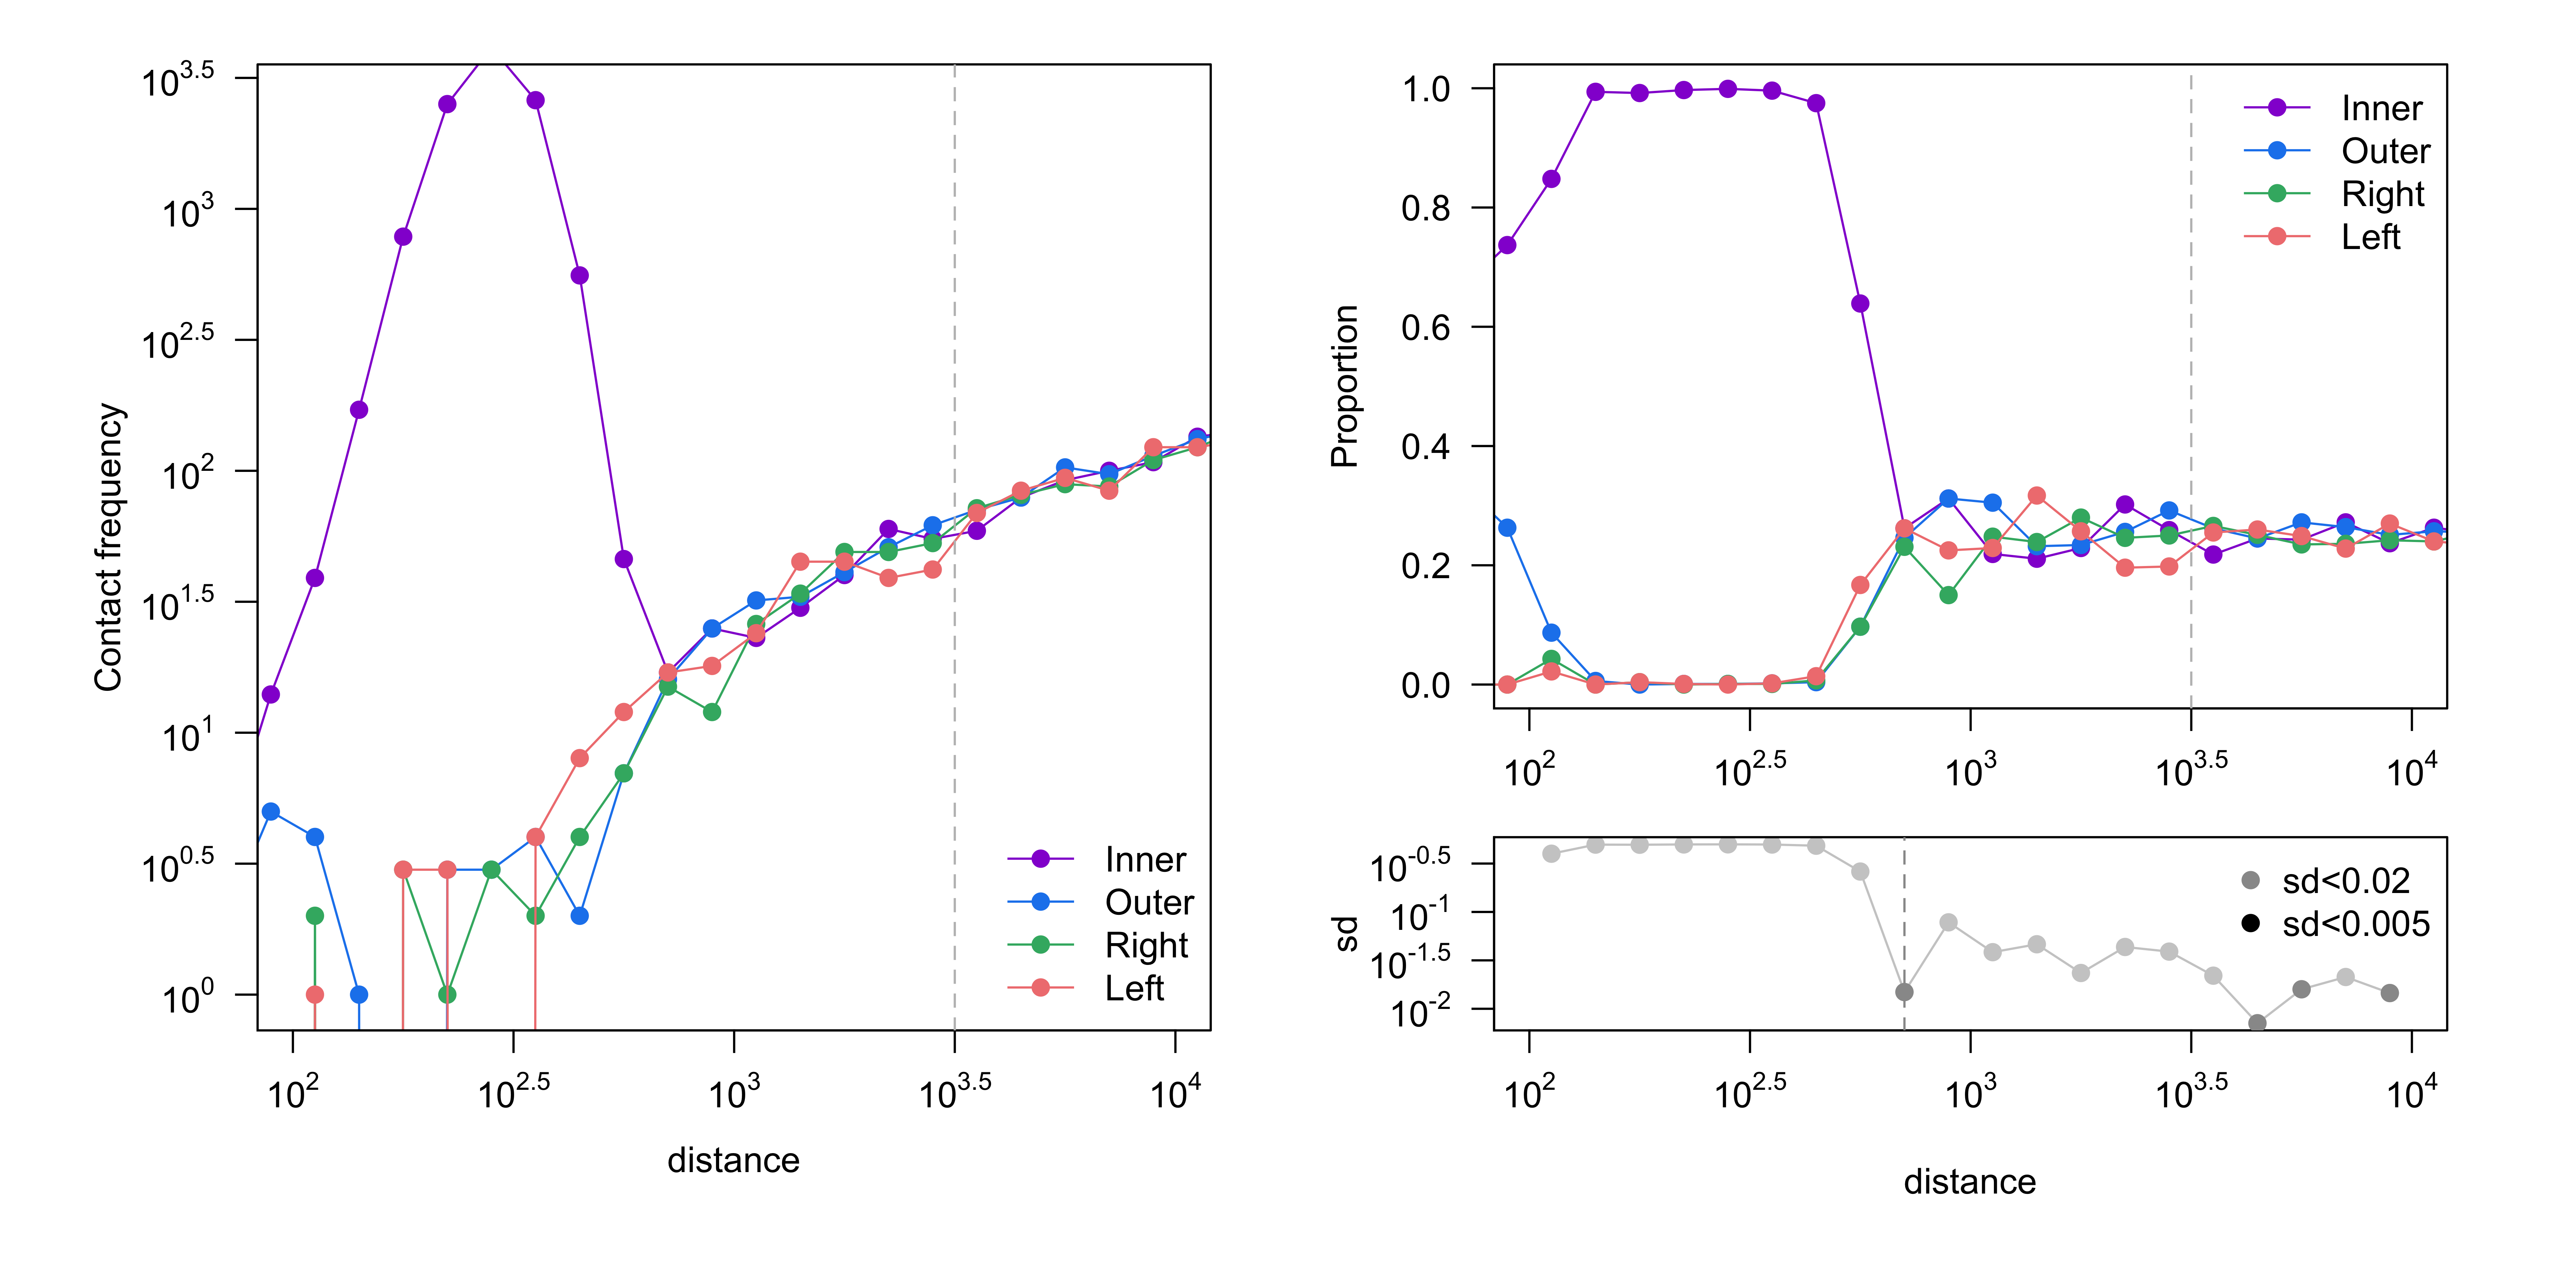
Contact frequency (number of reads, left) and proportion of reads (right) are shown, stratified by read orientation. Good four-cutter and six-cutter samples would converge at ~3kb (10^3.5) and ~30kb (10^4.5), respectively[1]. Convergence is determined by the standard deviation of the proportions being less than 0.005.
Figure 1. Get High-res Image Proportion of read orientation versus genomic separation : GM12878_Rao_subset
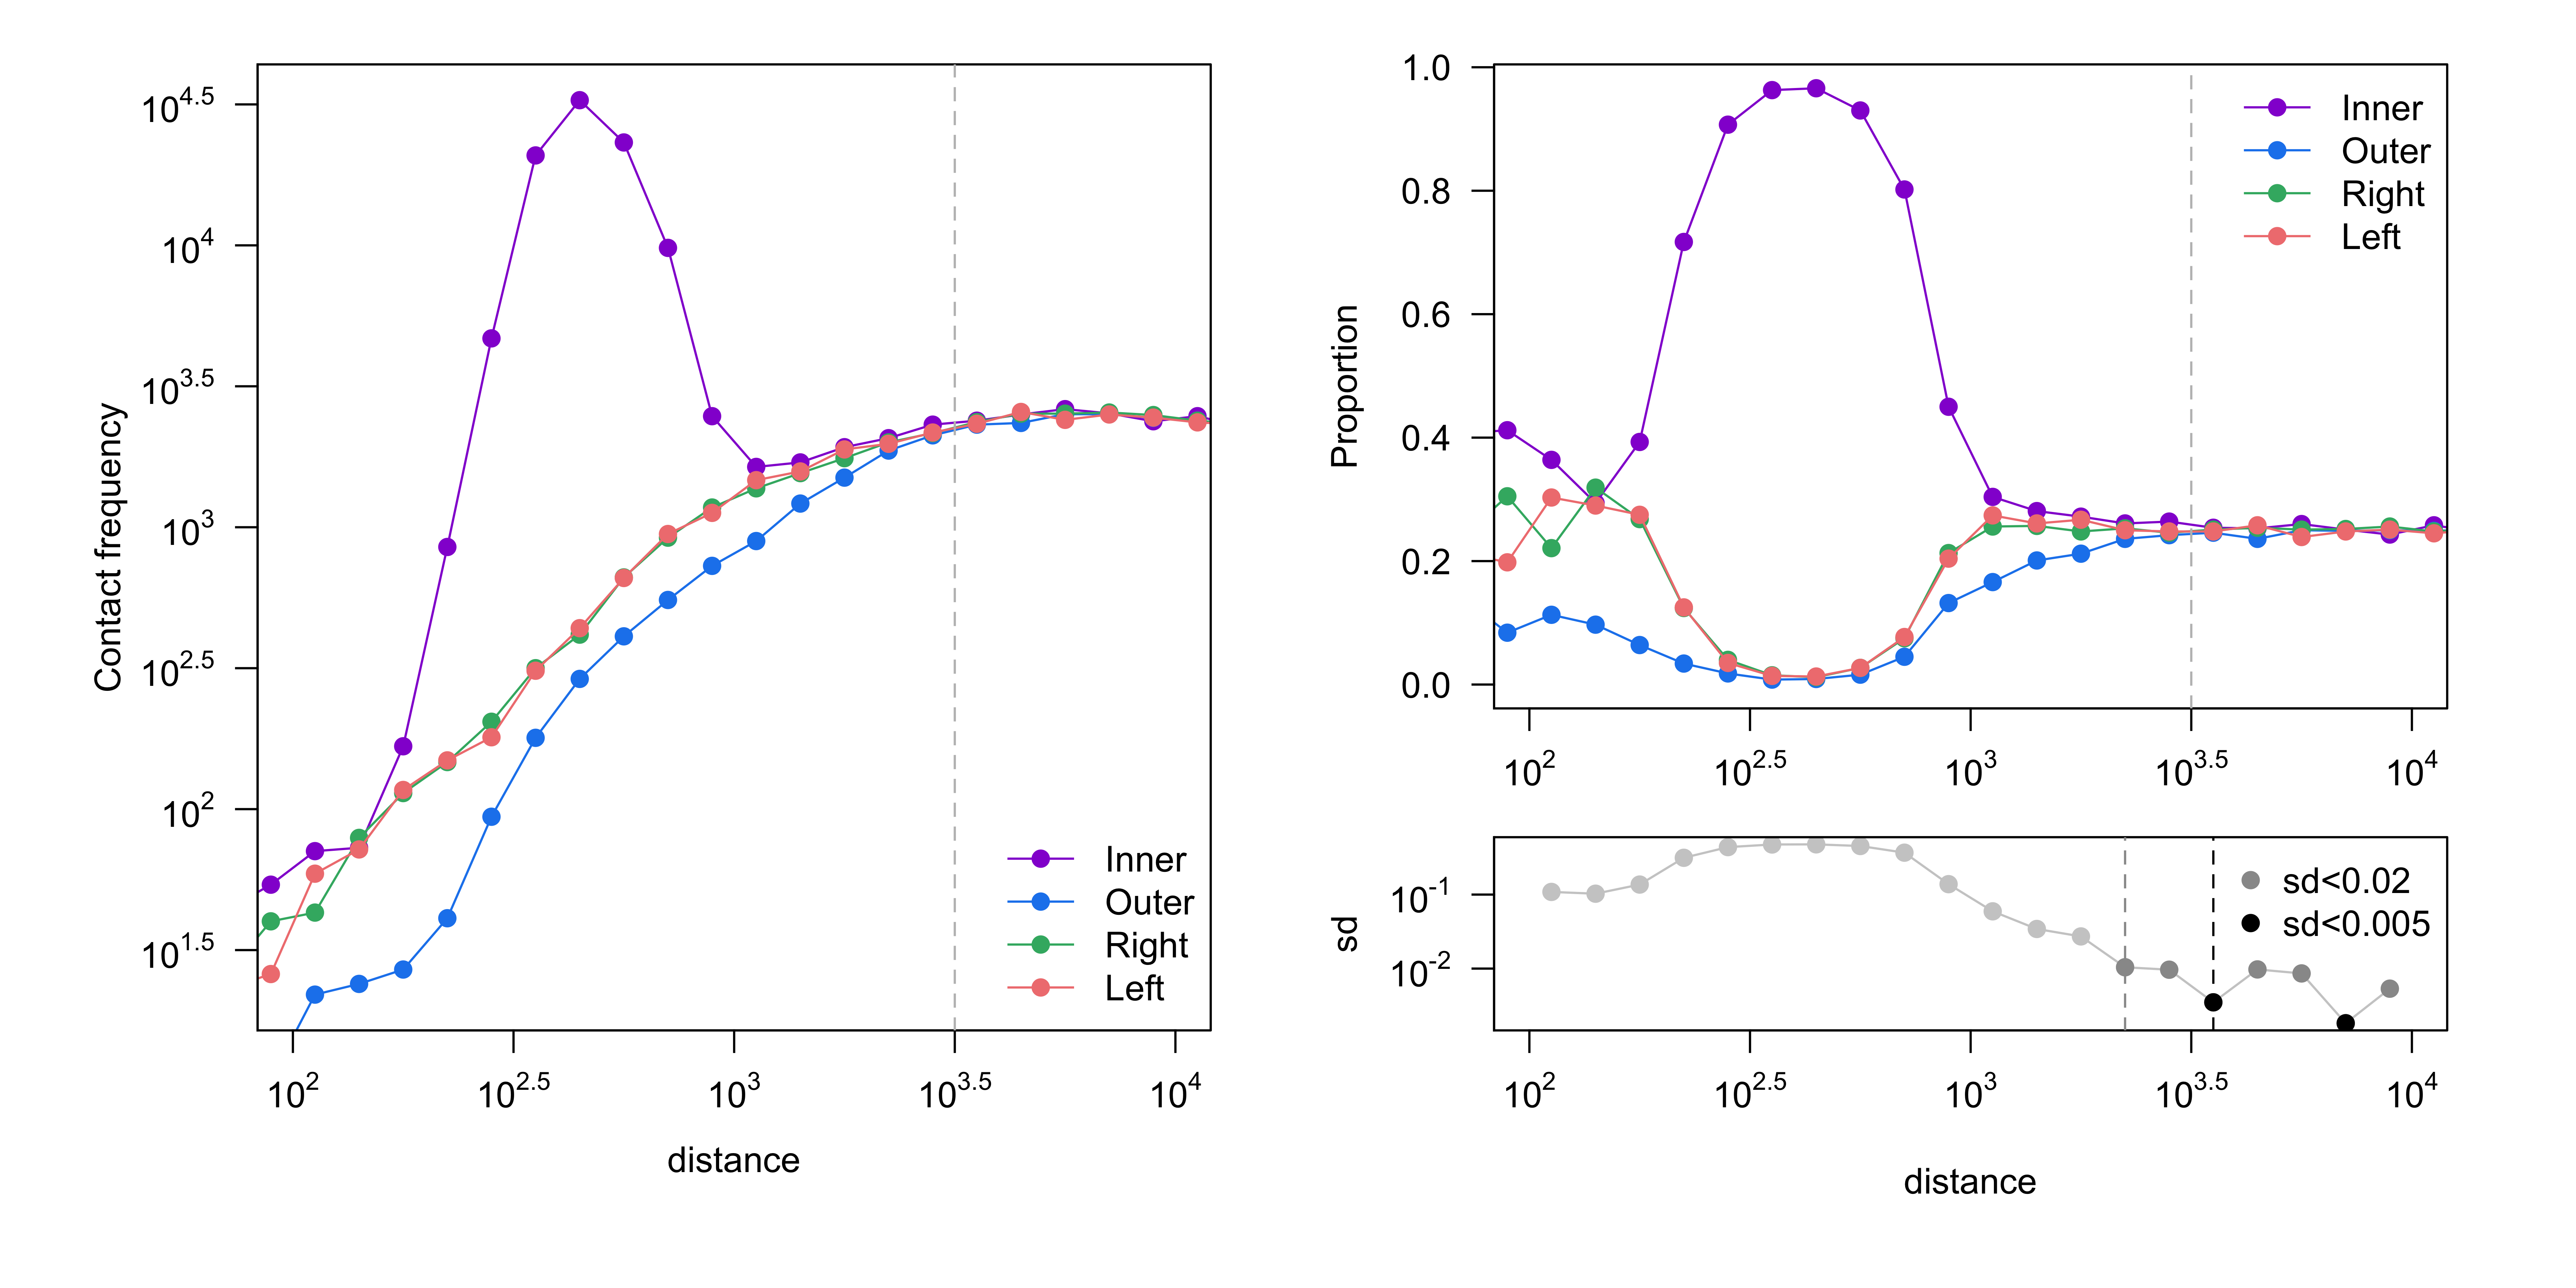
Figure 2. Get High-res Image Proportion of read orientation versus genomic separation : K562_Rao
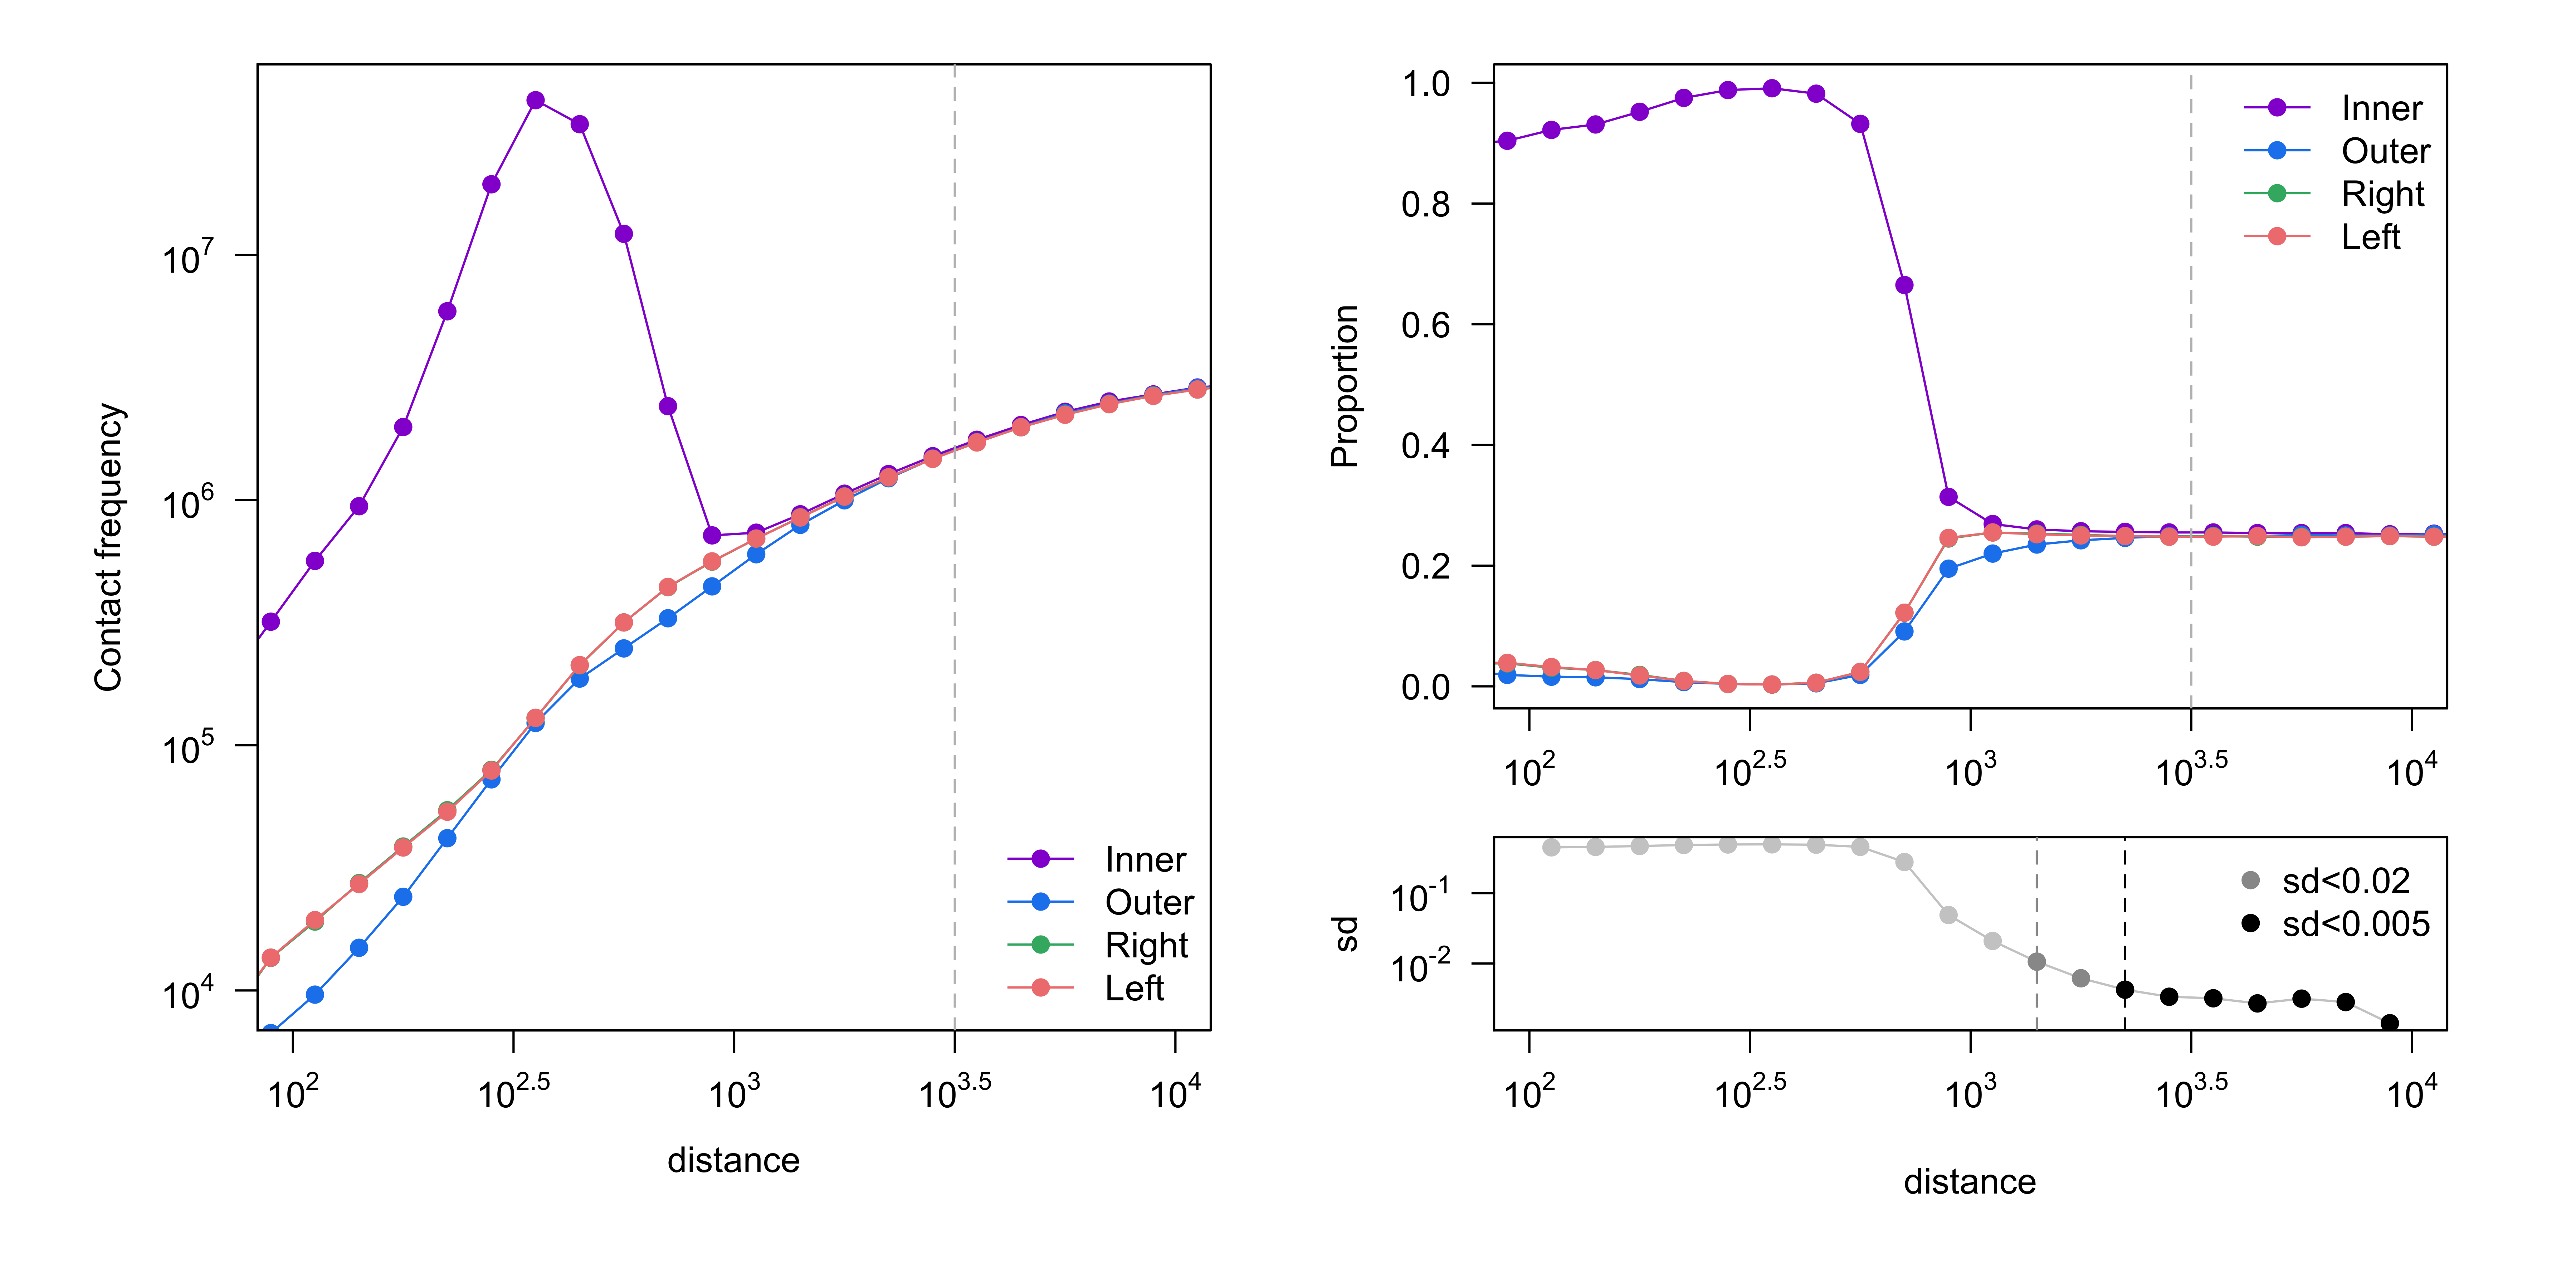
Figure 3. Get High-res Image Proportion of read orientation versus genomic separation : test
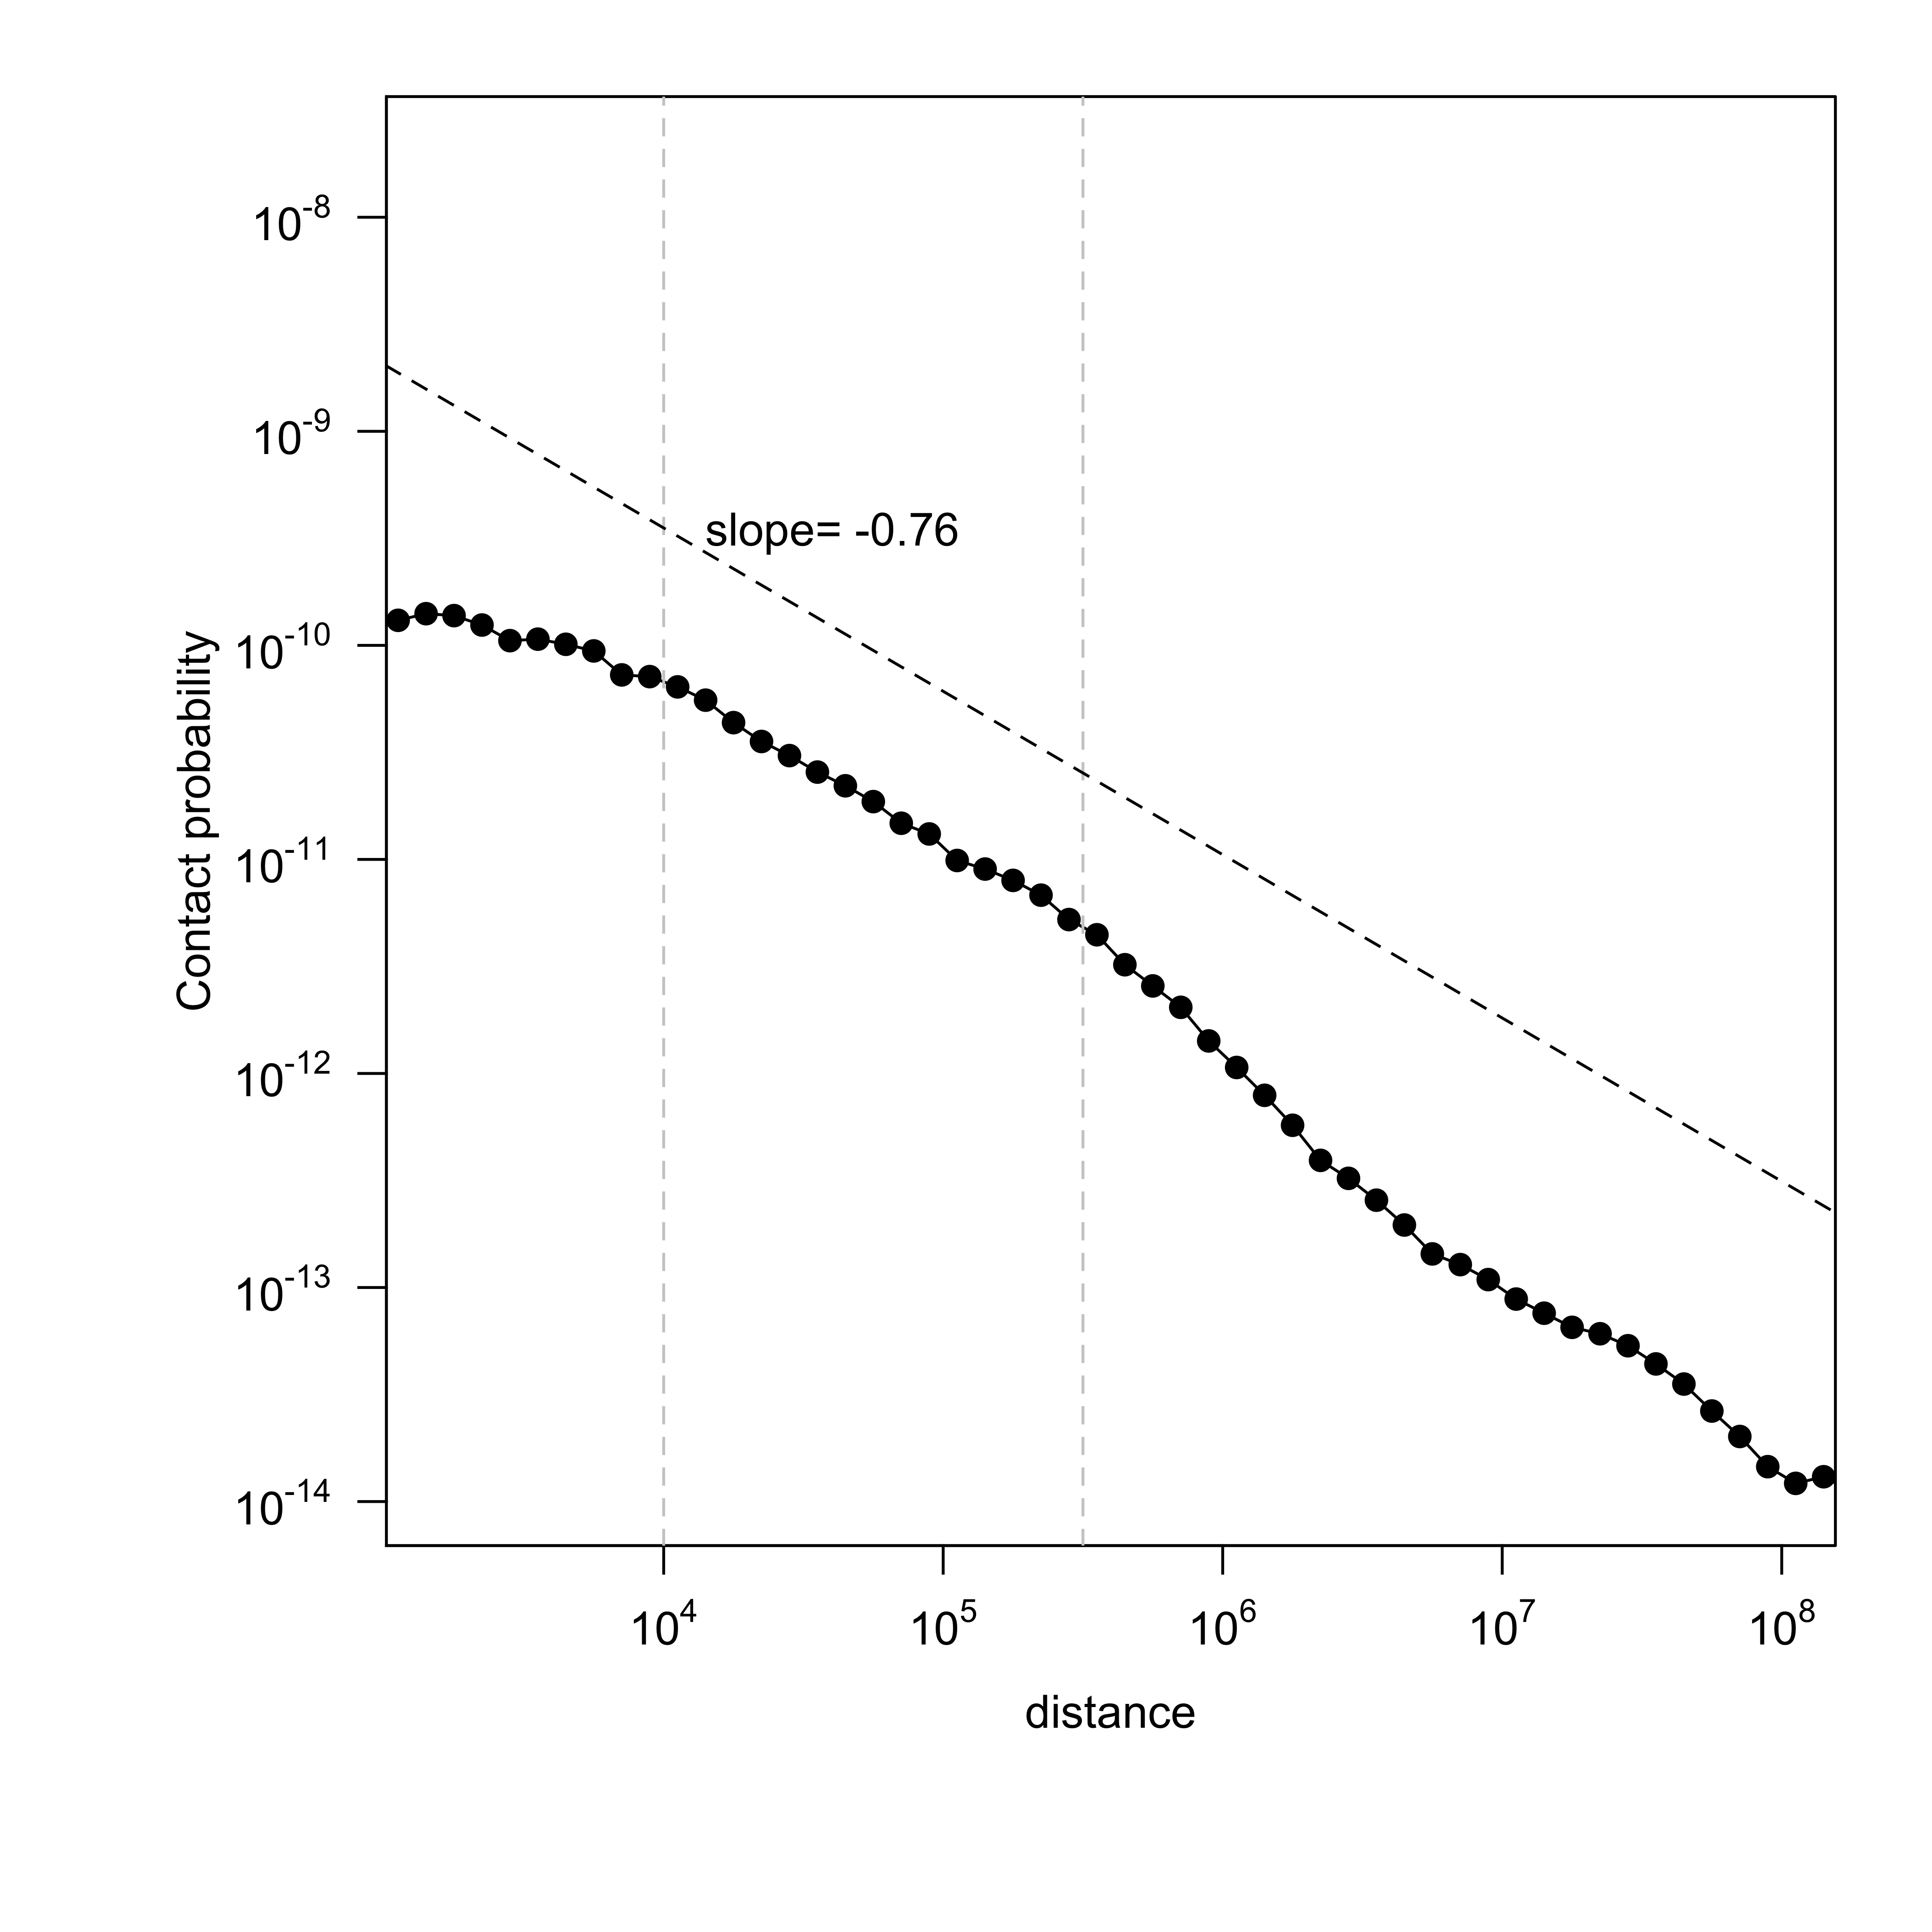
Contact probability (number of reads, normalized by number of bins and bin size) is shown with respect to genomic separation between mates[2][3]. The slope between distance 10kb ~ 300kb (10^4 ~ 10^5.5) representing a TAD is calculated. A good mitotic sample would have a slope close to ~ -0.76[3].
Figure 4. Get High-res Image Contact probability versus genomic separation : GM12878_Rao_subset
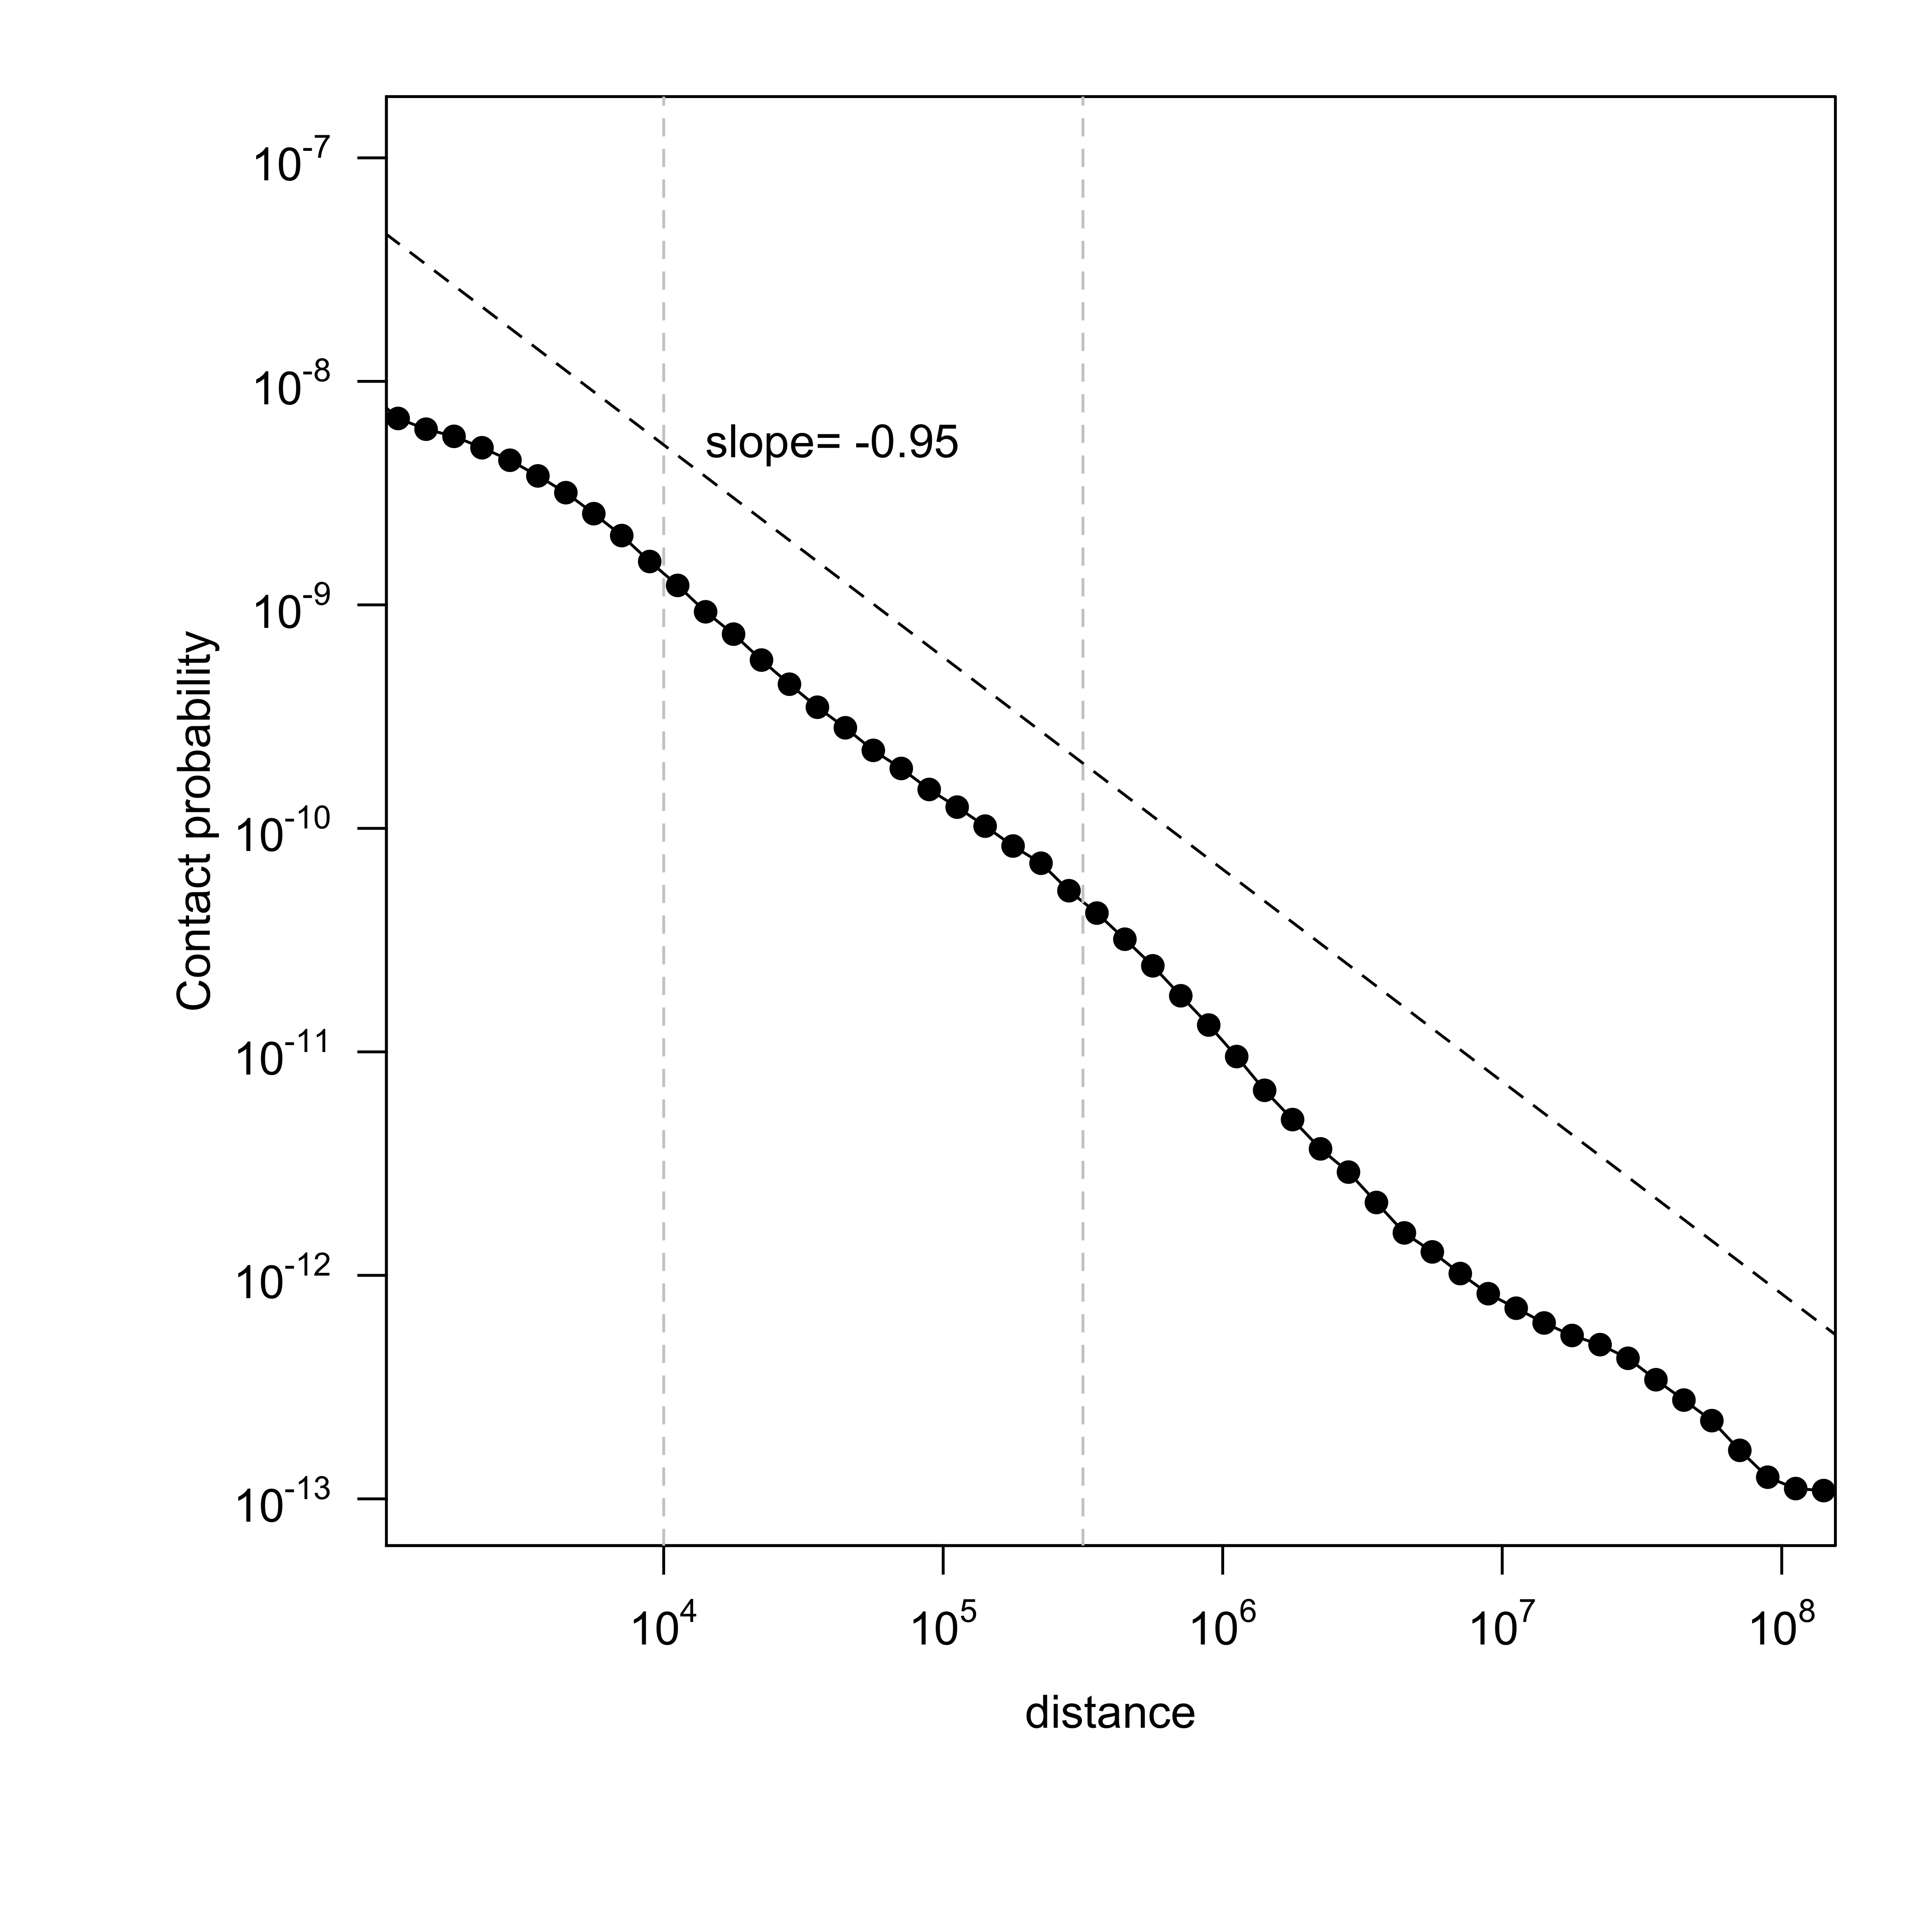
Figure 5. Get High-res Image Contact probability versus genomic separation : K562_Rao
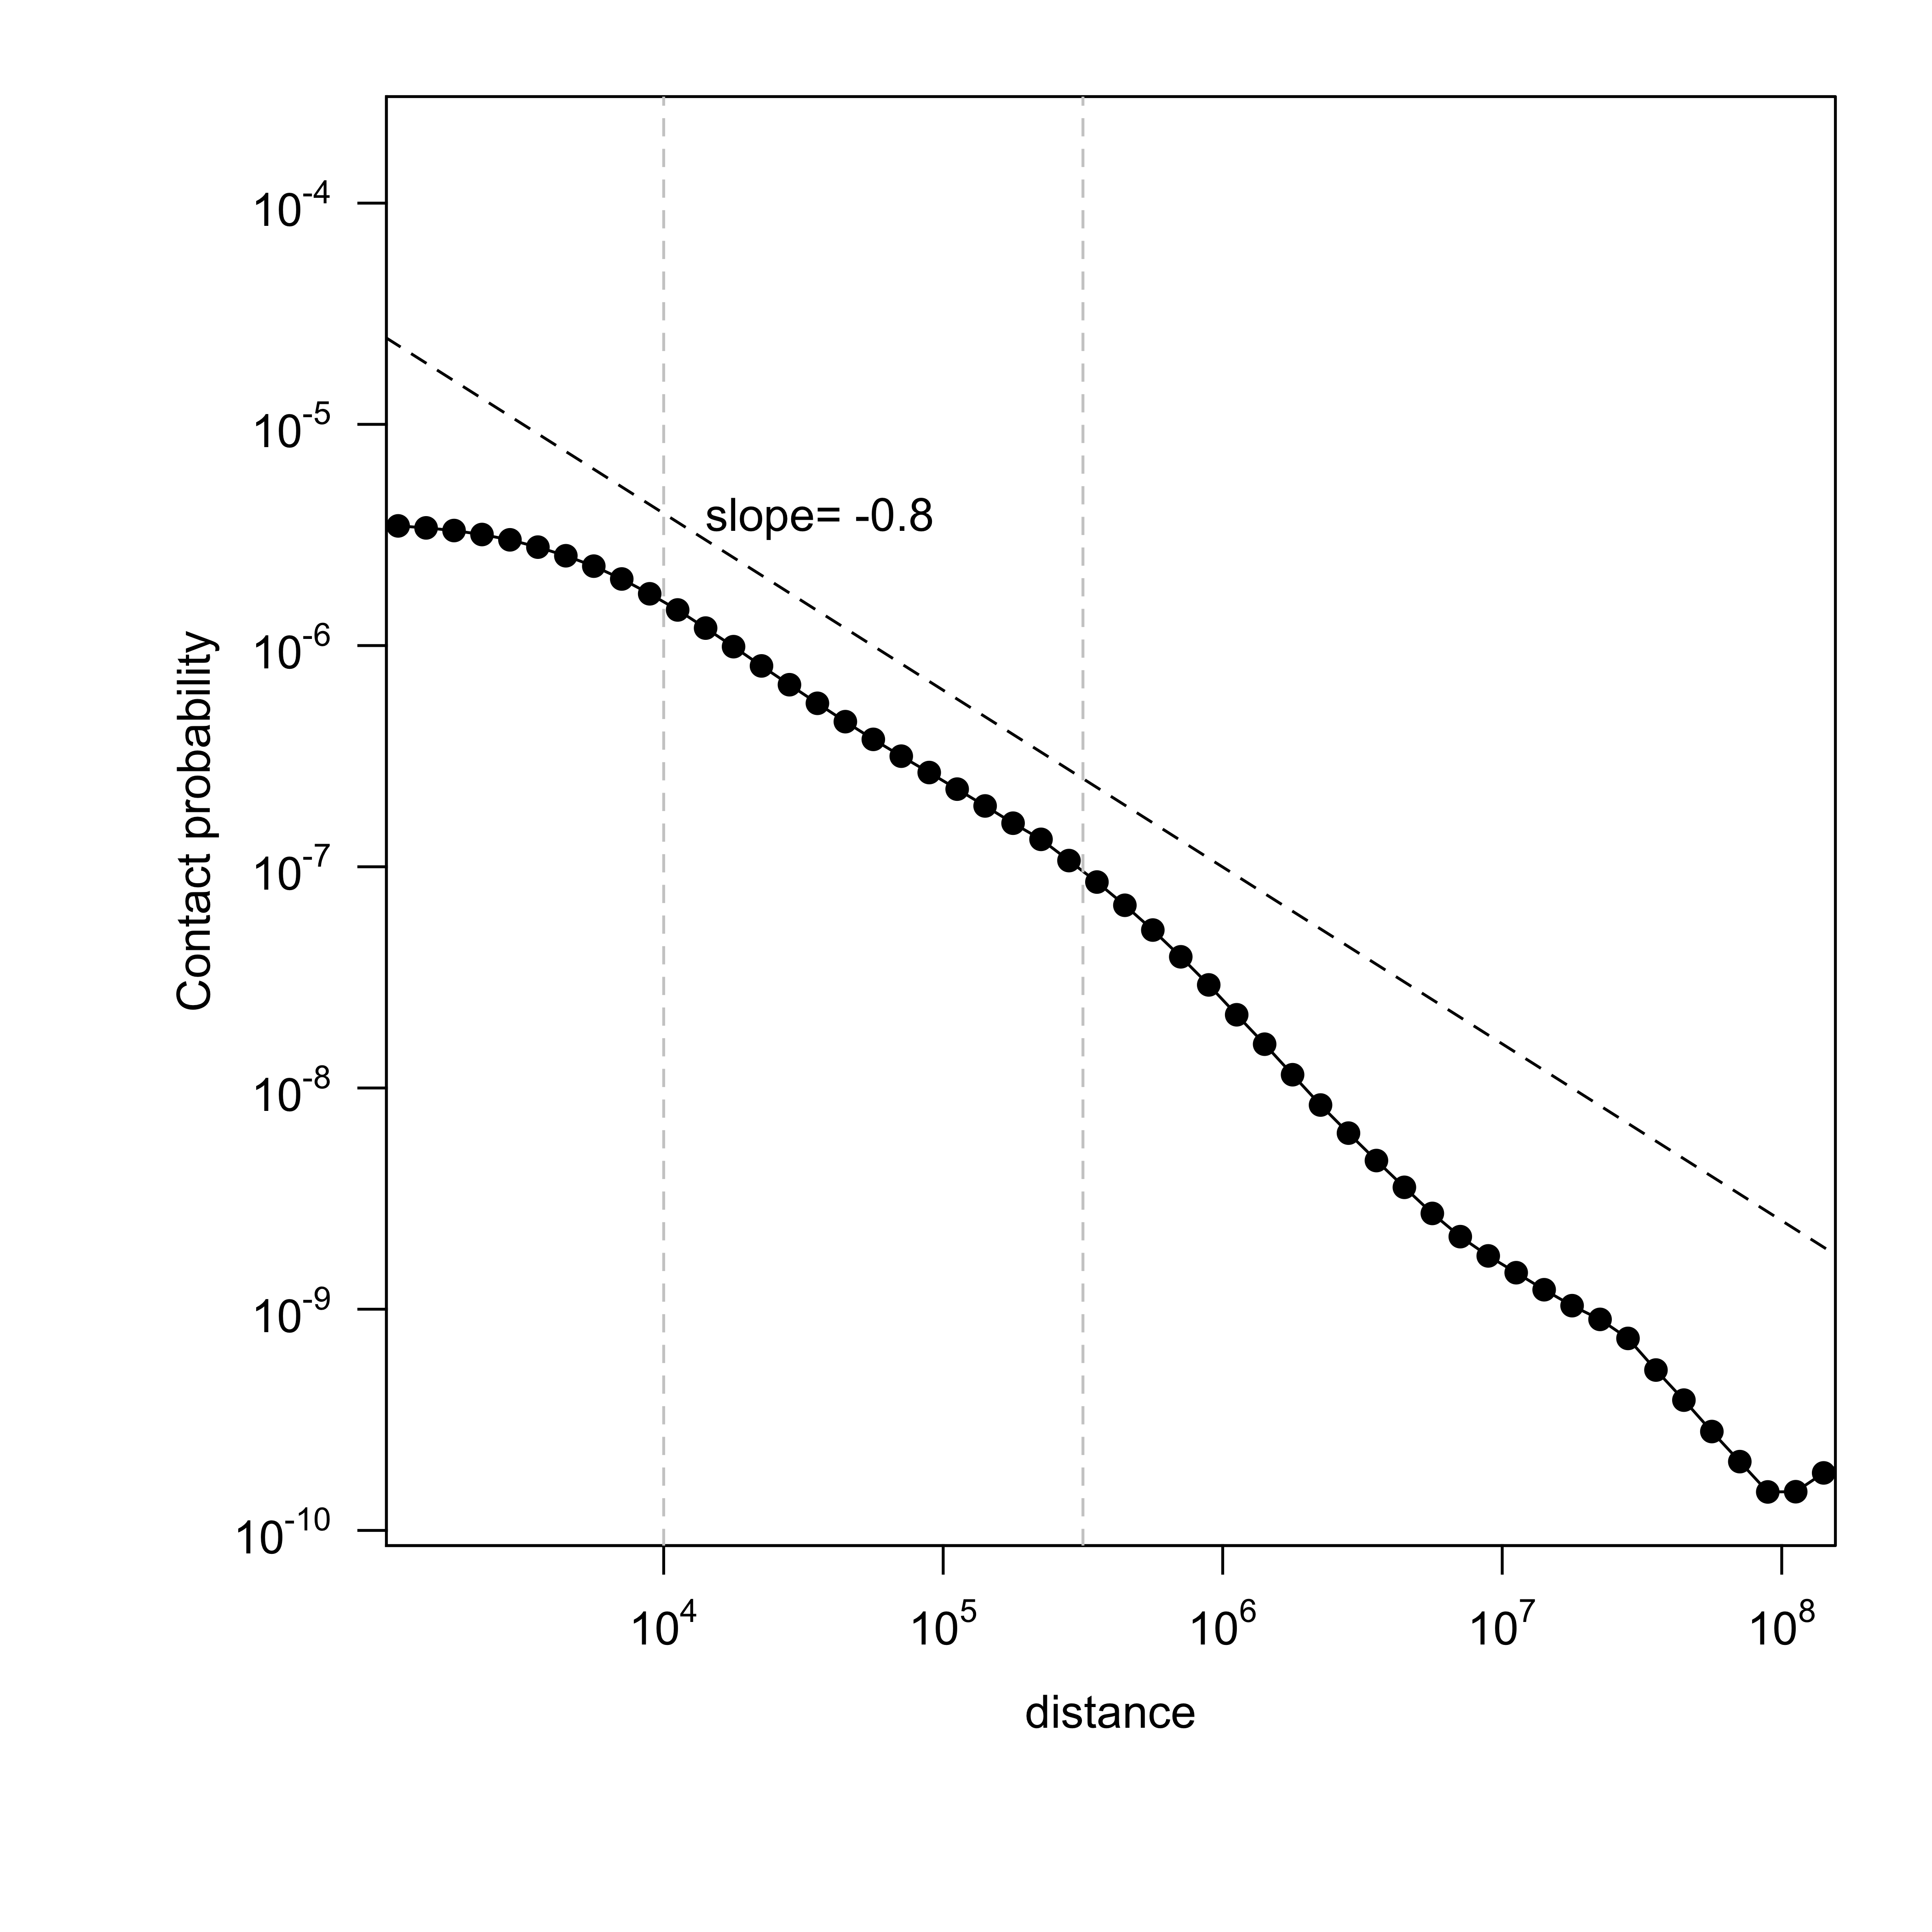
Figure 6. Get High-res Image Contact probability versus genomic separation : test
Interactive Figure 1. Contact probability versus genomic separation, per chromosome : GM12878_Rao_subset
Interactive Figure 2. Contact probability versus genomic separation, per chromosome : K562_Rao
Interactive Figure 3. Contact probability versus genomic separation, per chromosome : test