Navigating the Zerto Analytics Portal
When accessing Zerto Analytics, the Dashboard tab opens by default. This tab displays a summary of the entire protected environment, including the average RPO and VPG health, site details and topology, active alerts, running tasks and events.
Tip: Use the What’s New and Help
 widgets in Zerto Analytics to learn more about each of the features available in Zerto Analytics.
Tips:
| • | Use the sites topology to identify sites without remote protection, to identify network issues and to identify cloud issues. |
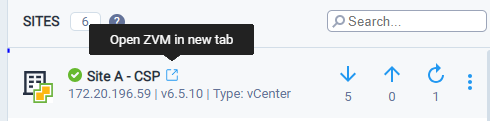
| • | To handle any issues in the ZVM site, in the Dashboard tab > SITES area, click the icon Open ZVM in a new tab. This routes you to the specific ZVM site. |
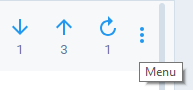
| • | In the same Sites area, click the Menu button to navigate to the VPGs, Alerts or Tasks for the specified site. |
In addition to the Dashboard, there are three additional views that provide details on the overall health of your environment.
See the following sections:
| 1. | Monitoring Alerts, Events and Tasks in Zerto Analytics |
| 2. | Troubleshooting VPGs in Zerto Analytics |
| 3. | Reviewing Reports in Zerto Analytics |
Monitoring Alerts, Events and Tasks in Zerto Analytics
From the Monitoring tab review the active alerts, alerts history, running events and tasks.
To see active alerts, events or tasks from a specific ZVM, use the filter in the top left of the screen  .
.
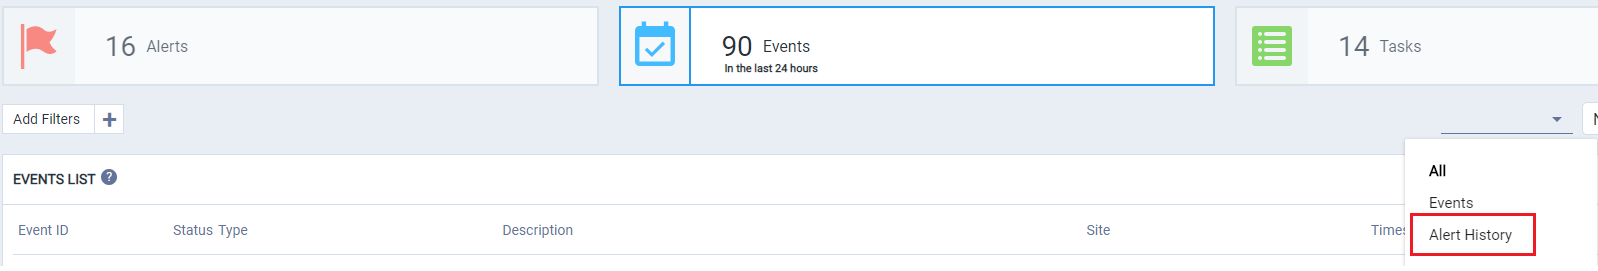
Events are displayed for the last 24 hours by default. Use the date selector to filter the Events List by date.
To view a history of alerts, select the Events tab and Alert History in the sub menu. Inactive alerts are displayed for the selected time range.
Tip:
Click the Alert ID and Event ID to open the help and view the full details for that specific alert or event.
Troubleshooting VPGs in Zerto Analytics
From the VPGs tab, review the list of VPGs with Errors and Warnings. In the VPGs status area, click either VPGs with Warnings or VPGs with Errors to filter the VPGs list.
To review the status of a VPG, click in the column of the VPG you want to review to open the VPG Details page. From here you can view the details of the virtual machines associated with the VPG as well.
If you want to view the details of another VPG, select the VPG from the VPGs drop-down list .
.
Tip:
To further investigate about a selected VPG, click the VPG History button, and select to view either the RPO, Journal or Network Reports page. (For more details about Reports, see Reviewing Reports in Zerto Analytics).
Reviewing Reports in Zerto Analytics
The Zerto Analytics reports provide real-time and historical data analysis. ECE and
Tip:
Zoom in to view more granular data by selecting and dragging your mouse over the selected time frame.
From the Reports tab, review the RPO, Journal and Network performance history on the VPGs.
Use the Network reports for reviewing the network history for any VPG or Site. You can also view the network summary for a selected time frame, the network performance history and IOPs history.
Use the RPO reports for viewing a summary to see if RPO SLAs are being met, the RPO history and the RPO breach table for viewing when the specific time breach occurred and the duration of the SLA breach.
Use the Journal reports for understanding if resilience is at risk due to journal storage capacity and plan for storage growth.
See also:
| • | Before getting started with Zerto Analytics |
| • | Accessing the Zerto Analytics Portal |
| • | Accessing Zerto Mobile |
| • | Accessing Zerto Analytics APIs |
| • | End-User Analytics for Service Providers |
| • | Zerto Analytics product feature matrix |
| • | Planning your data protection |
| • | Zerto Analytics secure architecture |