VPGs Tab in the Zerto Virtual Manager
List View - GENERAL
The following information is displayed in the GENERAL view:
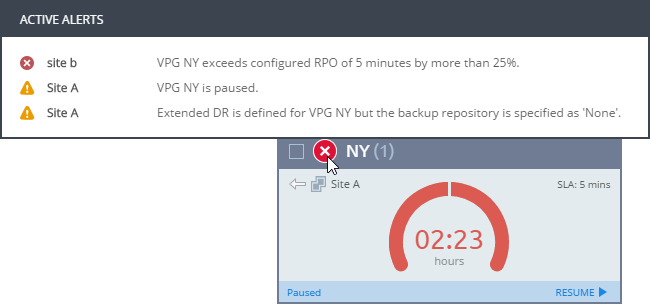
Alert status indicator – The color indicates the status of the VPG. Hovering over the alert displays a popup of all active alerts with descriptions:
Green – The VPG is being replicated, including syncing the VPG between the sites.
Orange – The VPG is being replicated but there are problems, such as an RPO value larger than the Target RPO Alert value specified for the VPG.
Red – The VPG is not being replicated, for example, because communication with the remote site is down.
Move the cursor over the Alert status indicator to display details of the alert.
VPG Name (#VMs) – The name of the VPG. The name is a link: Click the VPG name to drill-down to more specific details about the VPG that are displayed in a dynamic tab. The number of VMs protected in the VPG is displayed in parentheses.
Direction – The direction of the replication, from this site to the remote site or from the remote site to this site.
Peer Site – The name of the site with which this site is paired: the site where the VPG is protected or will be recovered to.
Priority – The priority of the VPG.
Protection Status – The current status of the VPG, such as Meeting SLA. Where appropriate, the percentage of the operation completed, such as syncing, is displayed.
State – The current substatus of the VPG, such as Delta syncing. Where appropriate, the percentage of the operation completed, such as syncing, is displayed.
Actual RPO – The time since the last checkpoint was written to the journal. This should be less than the Target RPO Alert value specified for the VPG.
Operation – The operation, such as Move, that is currently being performed.
List View - PERFORMANCE
The following information is displayed in the PERFORMANCE view:
IO – The IO per second between all the applications running on the virtual machines in the VPG and the VRA that sends a copy to the remote site for replication.
Throughput – The MB per second for all the applications running on the virtual machines being protected. There can be a high IO rate with lots of small writes resulting in a small throughput as well as a small IO with a large throughput. Thus, both the IOPS and Throughput values together provide a more accurate indication of performance.
Network – The amount of WAN traffic.
Provisioned Storage (not shown by default) – The provisioned storage for all the virtual machines in the VPG. This value is the sum of the values that are used in the vSphere Client console per virtual machine in the Virtual Machines tab for the root vCenter Server node. Each value is the sum of both the hard disk and memory. Thus, a virtual machine with 1GB hard disk and 4GB memory will show 5GB provisioned storage.
Used Storage – The storage used by all of the virtual machines in the VPG. This value is the sum of the values that are used in the vSphere Client console per virtual machine in the Virtual Machines tab for the root vCenter Server node.
List View - BACKUP
Throughput – The MB per second for all the applications running on the virtual machines being protected. There can be a high IO rate with lots of small writes resulting in a small throughput as well as a small IO with a large throughput. Thus, both the IOPS and Throughput values together provide a more accurate indication of performance.
Network – The amount of WAN traffic.
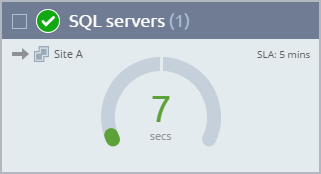
Grid ViewIn the grid view each VPG is displayed as a card.
The default view is of all the VPG cards, un-grouped and sorted by VPG name.
The cards displayed can be filtered by clicking the filter button(

). The default filters are
Direction and
Protection Status. You can click the
ADD button to open the filters drop-down, and select additional filters. Active filters are displayed with a yellow background.
Each card contains the following:
Alert status indicator – The color indicates the status of the VPG. Hovering over the alert displays a popup of all active alerts with descriptions:
Green – The VPG is being replicated, including syncing the VPG between the sites.
Orange – The VPG is being replicated but there are problems, such as an RPO value larger than the Target RPO Alert value specified for the VPG.
Red – The VPG is not being replicated, for example, because communication with the remote site is down.
Move the cursor over the Alert status indicator to display details of the alert.
VPG Name (#VMs) – The name of the VPG. The name is a link: Click the VPG name to drill-down to more specific details about the VPG that are displayed in a dynamic tab. The number of VMs protected in the VPG is displayed in parentheses.
Direction – The direction of the replication, from this site to the remote site or from the remote site to this site.
Peer Site – The name of the site with which this site is paired: the site where the VPG is protected or will be recovered to.
State – The current substatus of the VPG, such as Delta syncing. Where appropriate, the percentage of the operation completed, such as syncing, is displayed.
Actual RPO – The time since the last checkpoint was written to the journal. This should be less than the Target RPO Alert value specified for the VPG.
Operation – The operation, such as Move, that is currently being performed.
Saving Details of Virtual Protection Groups to File
You can save details of every VPG displayed in the VPGs tab to a CSV file, which can be opened using programs such as Microsoft Excel.
In the VPGs tab, click EXPORT and specify where to save the VPG details.