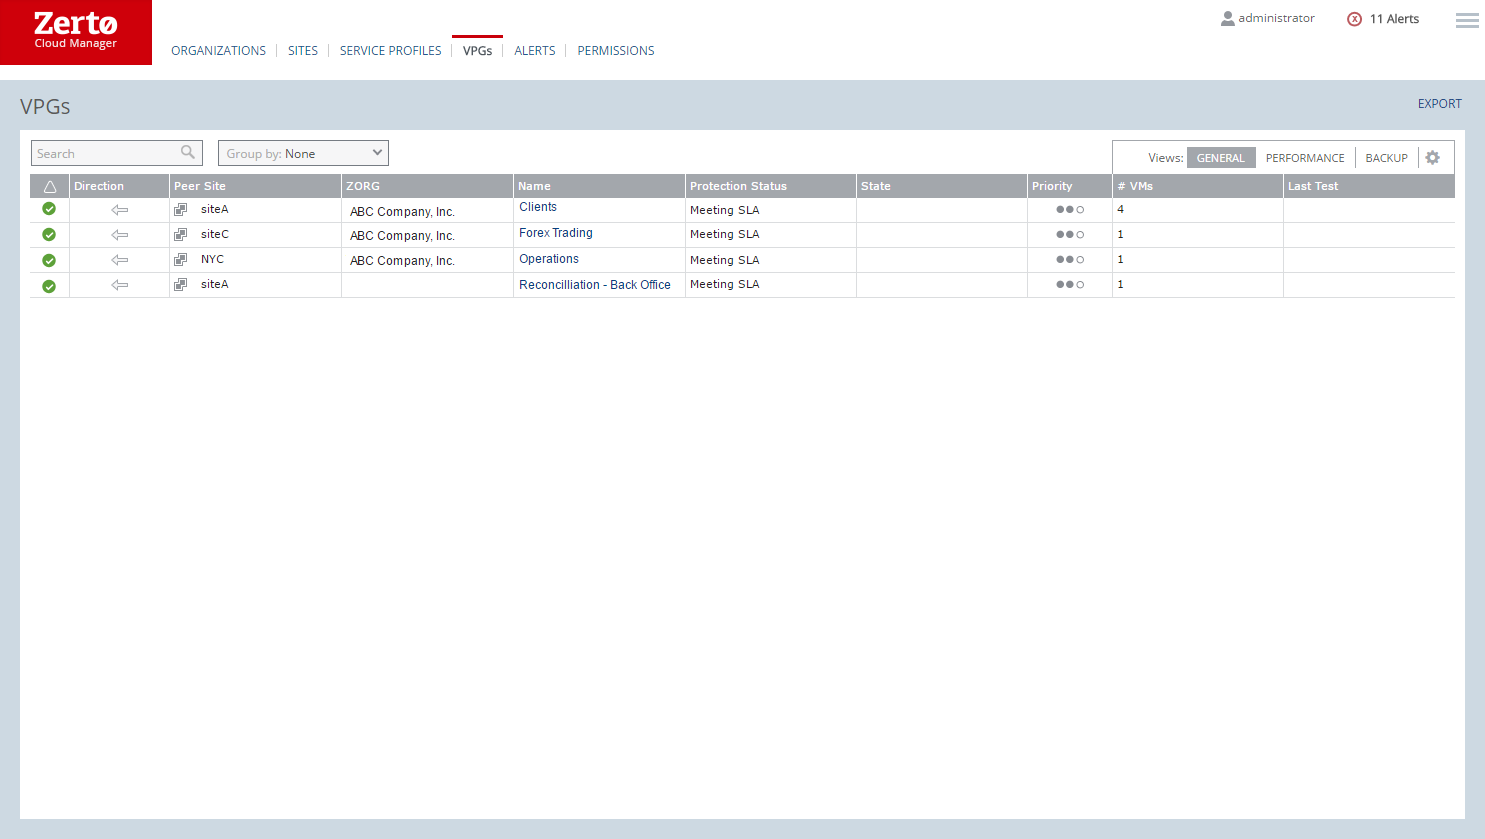
VPGs Tab in the Zerto Cloud Manager
Lists details of VPGs from all sites defined in the Zerto Cloud Manager.
When you right-click anywhere in this display, a menu is displayed in which you can choose Edit Columns. After you select it, the Edit Columns dialog is displayed, in which you can specify what columns to display in the list. You can also drag-and-drop column headers to rearrange the order of the columns. A thick vertical bar shows where a column can be dragged and dropped. You can also reset the display to the default display by clicking Reset Columns.
You can filter the display by clicking the filter icon in a column heading. Depending on the contents of the column, you can either choose filter values from the dropdown list that is displayed, or you can enter a value in the text box that is displayed. For example, you can filter the values in the Protection Status column by choosing Initializing, Meeting SLA, or Not Meeting SLA, or a combination of these values. You can filter the values in the name column by entering a value in the text box. The filter icon becomes visible when a filter is applied. Click Clear in the filter field to clear the filter.
Alert status indicator – The color indicates the alert status of the VPG:
Green – The VPG is being replicated, including syncing the VPG between sites.
Orange – The VPG is being replicated but there are problems, such as an RPO value larger than the Target RPO Alert value specified for the VPG.
Red – The VPG is not being replicated, for example, because communication with the remote site is down.
Direction – The direction of the replication, from this site to the remote site or from the remote site to this site.
Peer Site – The name of the site with which this site is paired: the site where the VPG is currently located or will be recovered to. After the name, there is an icon that represents the type of site.
ZORG – The name given to an organization in Zerto Cloud Manager.
Name – The name of the VPG. The name is a link: Click on the VPG name to drill-down to more specific details about the VPG that is displayed in a dynamic tab.
Protection Status – The current status of the VPG, such as Initializing or Meeting SLA. Where appropriate, the percentage of the operation completed, such as syncing, is displayed.
Priority – The priority specified for the VPG.
# VMs – The number of VMs in the VPG.
Provisioned Storage – The provisioned storage for all virtual machines in the VPG.
Note: For virtual machines in a VMware environment, this value is the sum of the values that are used in the vCenter Server and displayed in the vSphere Web client or Client console per virtual machine in the Virtual Machines tab for the root vCenter Server node. Each value is the sum of both the hard disk and memory. Thus, a virtual machine with 1GB hard disk and 4GB memory will show 5GB provisioned storage.
Used Storage – The storage used by all of the virtual machines in the VPG. This value is the sum of the values that are used in the vCenter Server and displayed in the vSphere Client console per virtual machine in the Virtual Machines tab for the root vCenter Server node.
Note: For virtual machines in a VMware environment, this value is the sum of the values that are used in the vCenter Server and displayed in the vSphere Web client or Client console per virtual machine in the Virtual Machines tab for the root vCenter Server node.
IO – The IO per second between all the applications running on the virtual machines in the VPG and the VRA that sends a copy to the remote site for replication.
Throughput – The MBs for all the applications running on the virtual machines being protected. There can be a high IO rate with lots of small writes resulting in a small throughput as well as a small IO with a large throughput. Thus, both the IOPS and Throughput values together provide a more accurate indication of performance.
Network – The amount of WAN traffic.
Actual RPO – The time since the last checkpoint was written to the journal. This should be less than the Target RPO Alert value specified for the VPG.
Last Test – The date and time of the last failover test performed on this VPG.
Retention Policy– Whether the VPG is protected against a disaster only with the ability to recover to a point in time up to 30 days before the disaster, or extended to include offsite backups of the virtual machines, going back to a maximum of one year.
Backup Status – The status of the backup.
Backup Repository – The name of the repository where the job is stored.
Restore Point Range – The restore points for the backup jobs out of the total backup jobs run for the VPG.
Backup Scheduling – The schedule for the offsite backup.