Monitoring Datastores – The SETUP Tab – The DATASTORES Tab
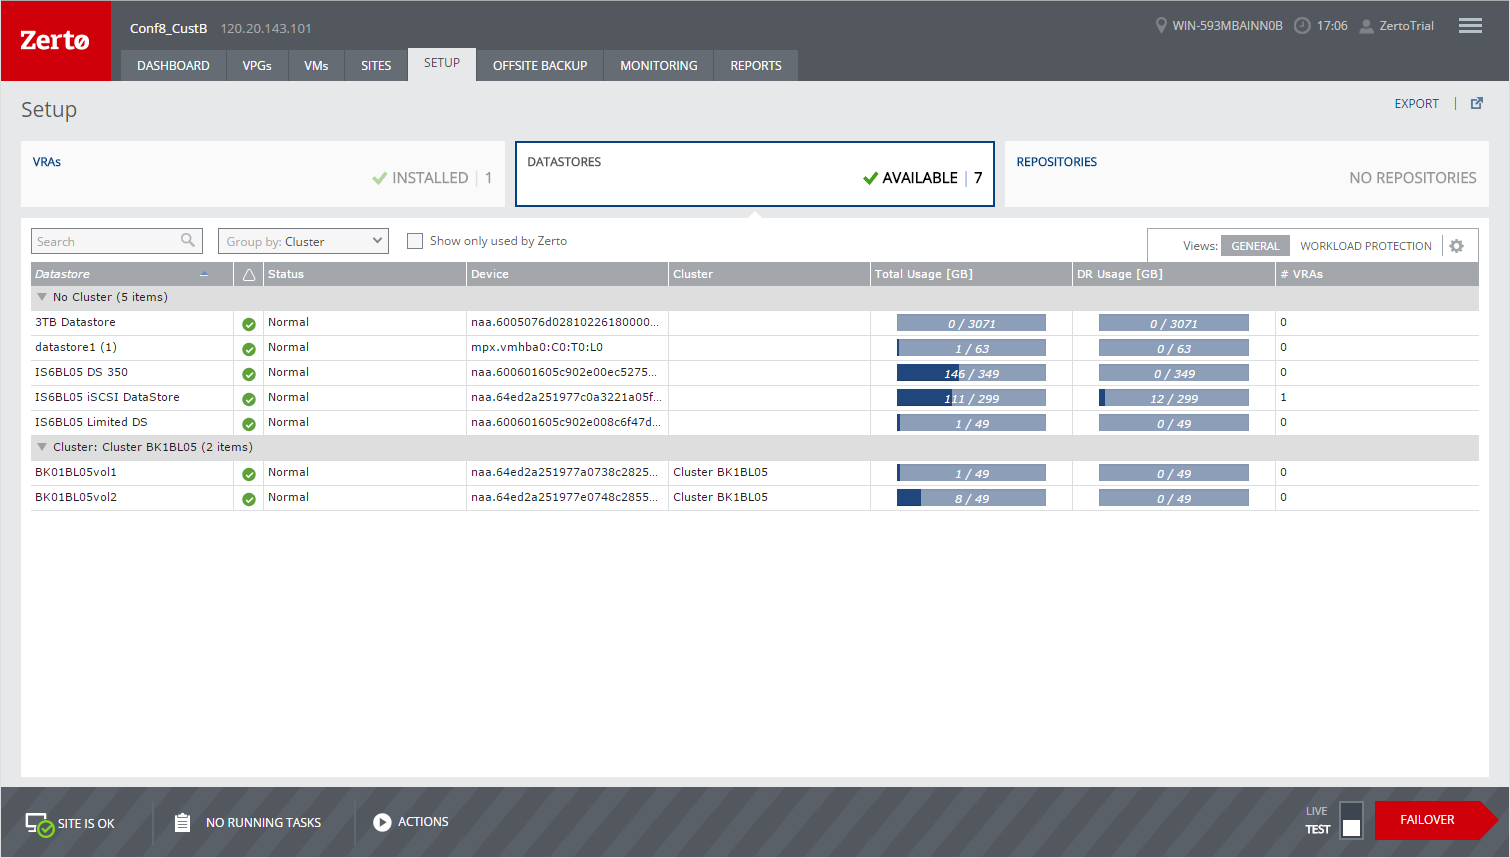
View details of the datastores used by Zerto Virtual Replication in the DATASTORES subtab, under the SETUP tab. This tab lists all the datastores used by Zerto Virtual Replication with an option to show all the datastores per cluster or for the hosts, whether used by Zerto Virtual Replication or not.
You can filter information in columns via the filter icon next to each column title. You can also sort the list by each column.
GENERAL View
In this view, the number of available datastores is displayed in the DATASTORES subtab. The following information is displayed in the GENERAL view:
Datastore – The name of the datastore or cluster.
Alert status indicator – The color indicates the alert status of the datastore:
Green – The datastore is functioning as required.
Orange – The datastore is functioning, but there are problems, such as not enough free space.
Red – There is a problem with the datastore.
Status – The status of the datastore.
Device – The datastore device identifier.
Cluster – The cluster that the datastore is associated with.
Total Usage (GB) – The amount of GB used in relation to the total amount available.
DR Usage (GB) – The amount of GB used by Zerto Virtual Replication in relation to the total amount available.
# VRAs – The number of VRAs using the datastore.
WORKLOAD PROTECTION View
The following information is displayed in the WORKLOAD PROTECTION view:
Datastore – The name of the datastore or cluster.
Alert status indicator – The color indicates the alert status of the datastore:
Green – The datastore is functioning as required.
Orange – The datastore is functioning, but there are problems, such as not enough free space.
Red – There is a problem with the datastore.
Total Usage (GB) – The amount of space, in GB, used in relation to the total amount available.
Type – The type of datastore.
Recovery Size – The amount of space used for recovery.
Journal Size – The amount of space used by the journals.
# Protected VMs – The number of protected virtual machines using the datastore.
# Incoming VMs – The number of virtual machines to be recovered using the datastore.
Additional Fields
There are no additional fields that you can display. However, you can display all the fields shown in these views when you select
Show/Hide Columns from the dropdown list shown by clicking the configuration icon (

).