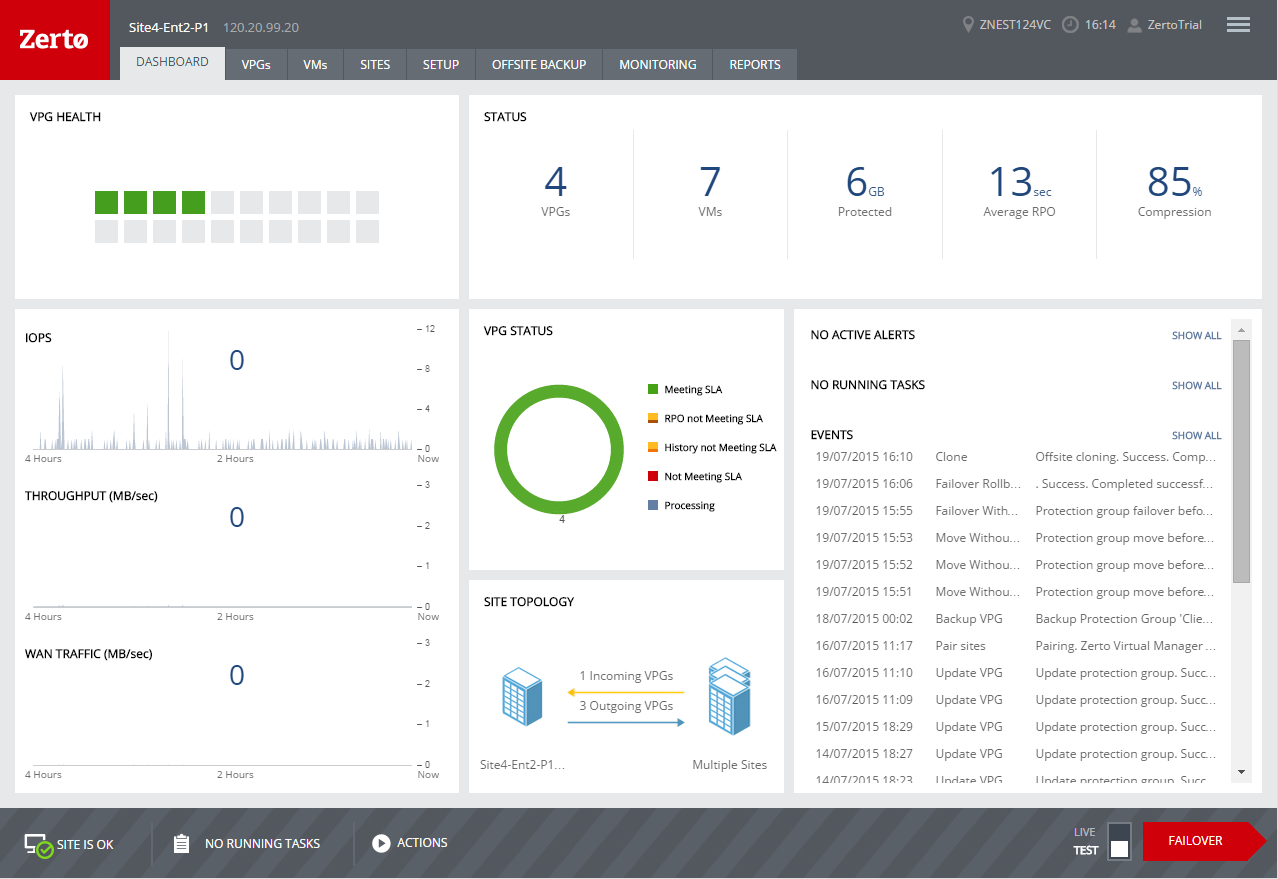
The DASHBOARD Tab
The DASHBOARD provides an overview of the sites and VPGs being protected at the site or recovered to the site.
The following information is displayed:
VPG HEALTH
The VPGs being recovered to AWS with the number of active alerts and the health of each VPG, represented by a colored block, where the color represents the following:
Green – The VPG is being replicated, including syncing the VPG between the sites.
Orange – The VPG is being replicated but there are problems, such as an RPO value larger than the target RPO value specified for the VPG.
Red – The VPG is not being replicated, for example because communication with AWS is down.
Positioning the mouse over a block displays the VPG name as a tooltip. Clicking the block opens the details tab for the VPG.
STATUS
The status of the site, including the following:
■ The number of VPGs and virtual machines being protected or recovered.
■ The amount of storage being protected.
■ The average RPO.
■ The percentage compression of data passed between the site and peer sites.
Performance Graphs
The current site performance, which includes the following information:
IOPS – The IO per second between all the applications running on the virtual machines being protected and the VRA that sends a copy to the remote site for replication.
Throughput (MB/sec) – The MBs for all the applications running on the virtual machines being protected. There can be a high IO rate with lots of small writes resulting in a small throughput as well as a small IO with a large throughput. Thus, both the IOPS and Throughput values together provide a more accurate indication of performance.
WAN Traffic (MB/sec) – The outgoing traffic between the sites.
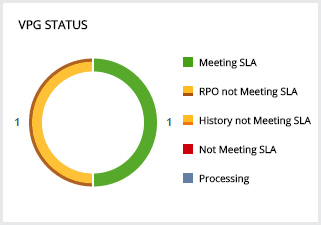
VPG STATUS
The status of the VPGs displayed as a pie chart. The legend describes what the pie chart colors represent.
SITE TOPOLOGY
A graphical display of the sites including the number of VPGs.
ACTIVE ALERTS, RUNNING TASKS, and EVENTS
A listing of the currently active alerts and running tasks, and the events run during the last few hours.
User input, for example, stopping a failover test or committing or rolling back a Move or Failover operation, can be initiated from the relevant task displayed in the RUNNING TASKS section.