Add a New Field to an Existing Data View
After you create a view, you can edit its basic information, change the view name, add, remove, or edit fields within the schema as well as apply SQL filters.
Note: Each user's profile is uniquely configured and permissioned. Your data view and options may differ slightly depending on the permissions granted.
Caution: You must have a clear understanding of the database schema to be able to manage data sources and views. Database schemas are blueprints of how the data is organized in the database. Upland Analytics allows for great flexibility in managing the data sources and views but it is only recommended for users with knowledge and understanding of the database schemas and its administration.
- Click Analytics Settings on the Main Menu Bar.
- Select Data Views from the menu. The Data Views page displays a list of all available data views.
- Select the data view you want to edit.
- Click Edit. The Views page displays.
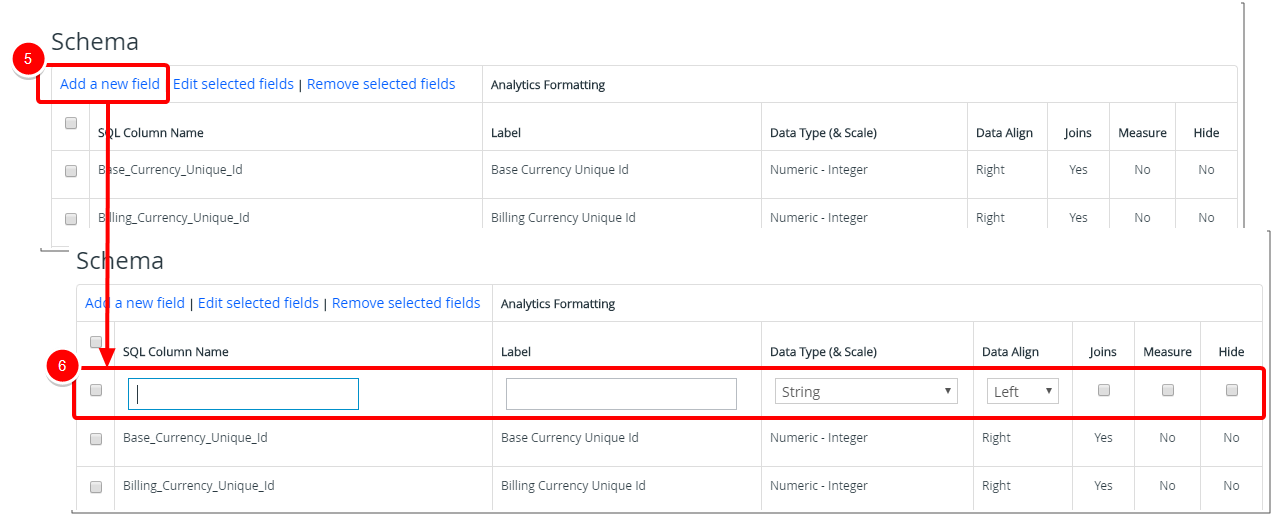
- Click Add a new Field in the Schema section.
- A new editable line item will be added to the list where you can create the new field:
- SQL Column Name: Type the necessary SQL Column Name.
- Label: Type a Label for the SQL Column Name.
- Data Type (& Scale): The data type is a label and a guideline for SQL to understand what type of data is expected inside of each column, and it also identifies how SQL will interact with the stored data. Select a Data Type (& Scale) from the available options:
- Select Text and then select String.
- Select Numeric and then select from Integer, Decimal, Percent or Money.
- Select Date/Time and then select from Date, Time, Date Time, Hour of Day (0-23), Day of Week (1-7) or Time Lapse (Seconds).
- Select Aggregate Date and then select from Week, Month, Month Year, Quarter, Quarter Year or Year.
- Select Others and then choose from Boolean (True/False), User ID (String) or File Size (Integer).
- Data Align: Select a Data Align option from the available options:
- Measure: Select if the field is a Measure.
- Hide: Select if the field should be hidden from view.
- Repeat step 5-6 to add more than one field to your data view.
- Click Save to apply your changes. You can use your new field when creating a report or graph/chart.

Note: Alternatively, click Save & Add New, to apply your changes and then create a new data view.