Edit a Graph/Chart
You can completely modify and customize any graph/chart in Upland Analytics to help create the perfect fit for your business needs.
- Do one of the following to edit an existing graph/chart:
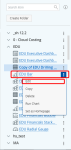
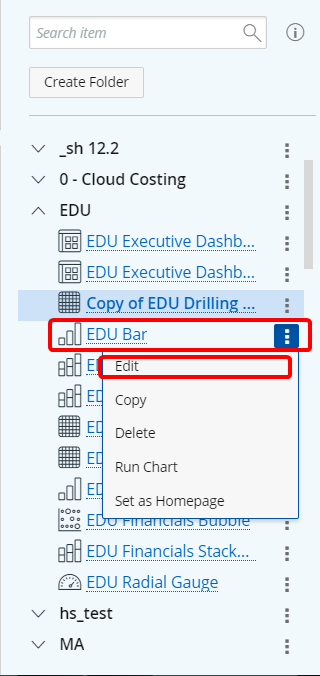
- From the Navigation menu, click
 located on the right of the graph/chart name you want to edit and click Edit.
- From the Navigation menu, click
- From an existing graph/chart, open the Main Menu bar and click
 .
. - Modify the graph/chart as necessary. See Available Graph/Chart Options for field definitions.
Tip: Create a new copy of the existing graph/chart before editing it to keep the original as a backup.
Note: The options and steps on how to edit a graph/chart is similar to the steps options available to upon graph/chart creation. For further assistance on what options are available to you refer to the topics listed below.