GeoWave Quickstart Guide Integrate with the Cluster 
|
If you have not successfully completed the GeoServer Integration section, please do so before continuing. |
Enable Web Connections (EMR Only)
Go to the Cluster List (“Services” dropdown, select EMR) and click on the cluster you created. Use the “Master public DNS” value as your hostname and the security key you assigned to the cluster to enable the web connection.
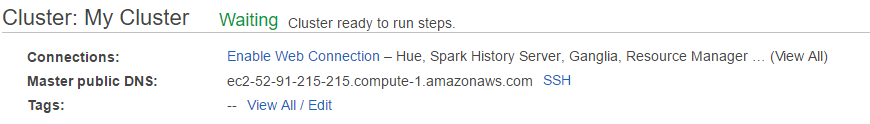
If you are unfamiliar how to do this click on the “Enable Web Connection” link for detailed instructions on how to enable the web connection for Linux or Windows.
|
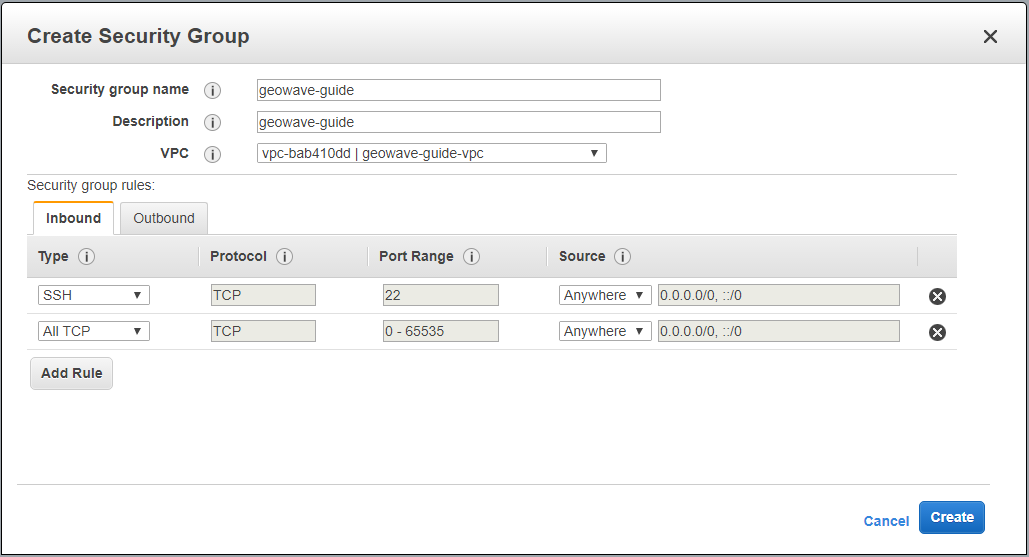
You can also enable the web connection by adding a rule to your security group of Type: "All TCP" and source "Anywhere" |
HBase Master View
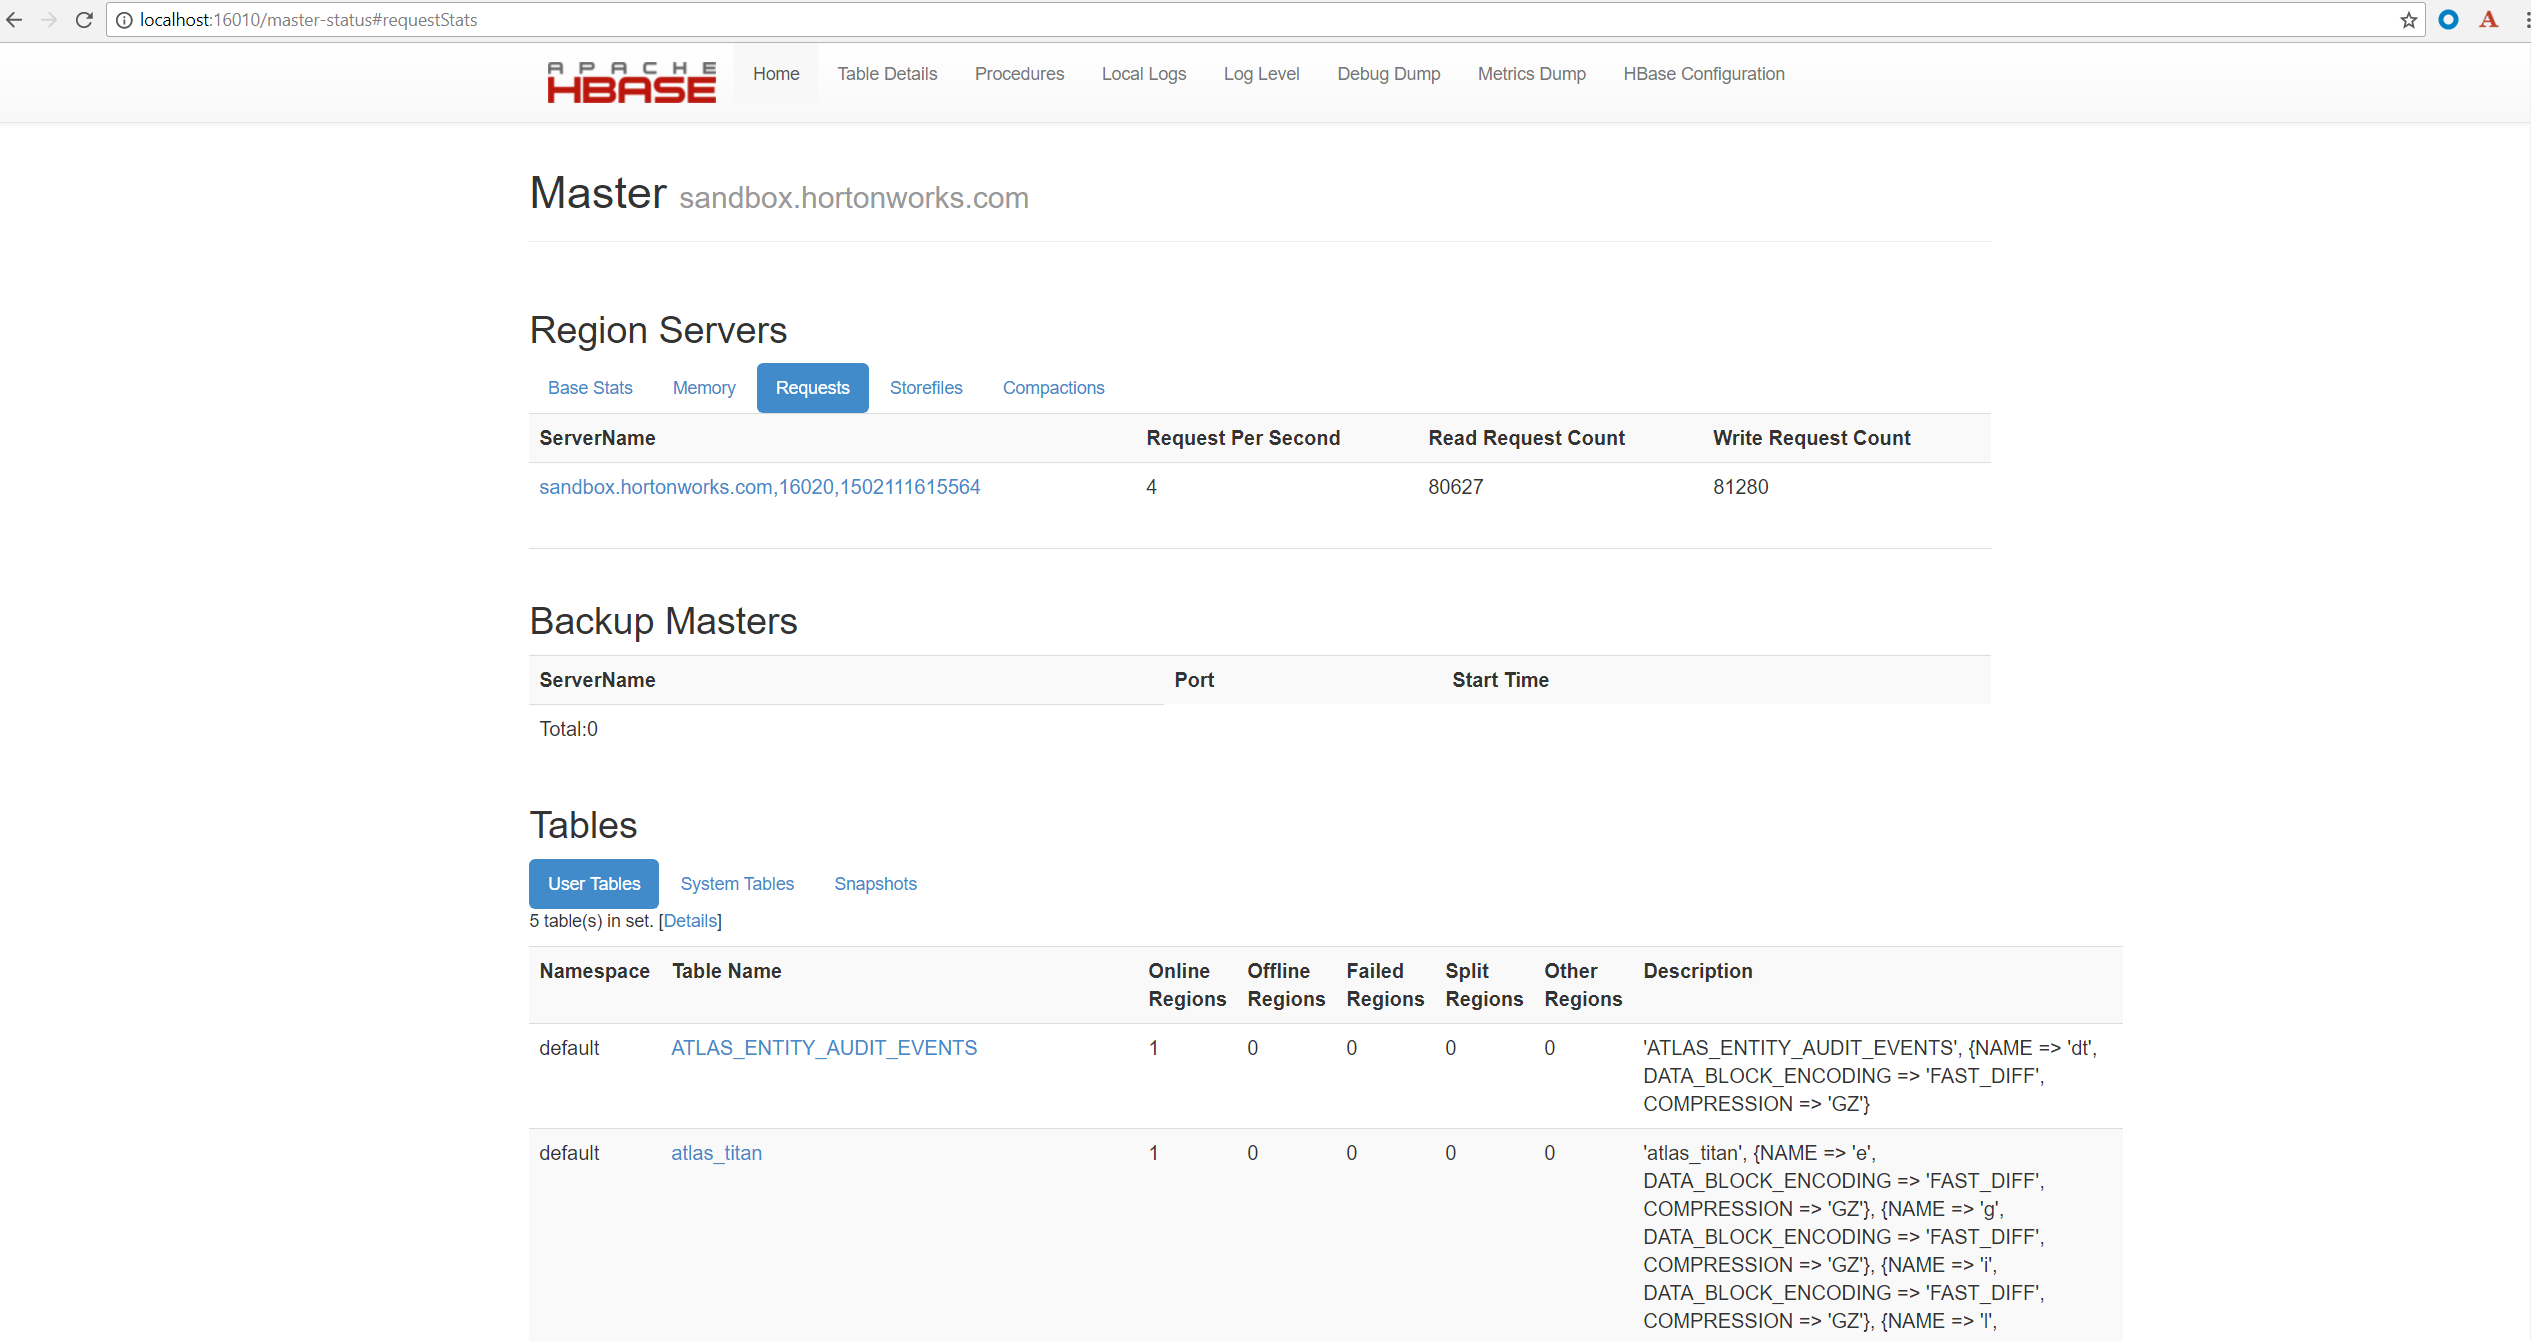
HBase status can be monitored via the HBase web interface at http://localhost:16010 (${Master_public_DNS}:16010 for EMR). The interface provides information on the number of reads/writes, requests per second, and the status of its servers. If HBase experiences any issues during the ingest, they will be reflected here.
Accumulo View
You can follow the progress of the data ingest and scan (kde) performed by the cluster on the accumulo web server.
Open a new tab in your web browser and enter the Master public DNS of your cluster followed by :9995
-
Example: ec2-52-91-215-215.compute-1.amazonaws.com:9995
You should see the following page:
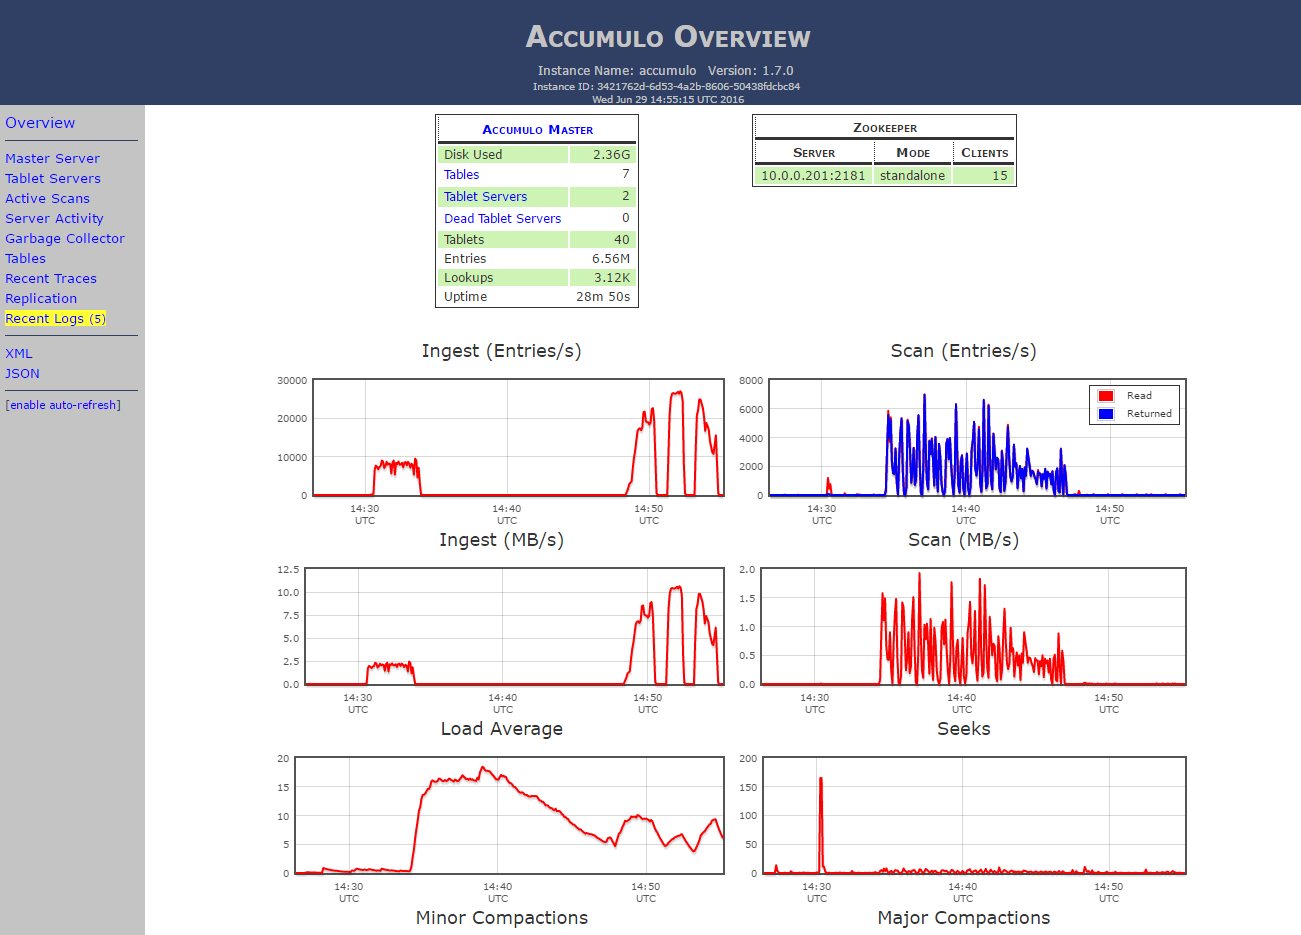
|
This page is only available if you are using the Accumulo set-up |
GeoServer
The GeoServer web interface can be accessed in your browser:
-
http://localhost:8993/geoserver/web (Sandbox)
-
${Master_public_DNS}:8000/geoserver/web (EMR)
Login to see the layers.
-
Username: admin
-
Password: geoserver
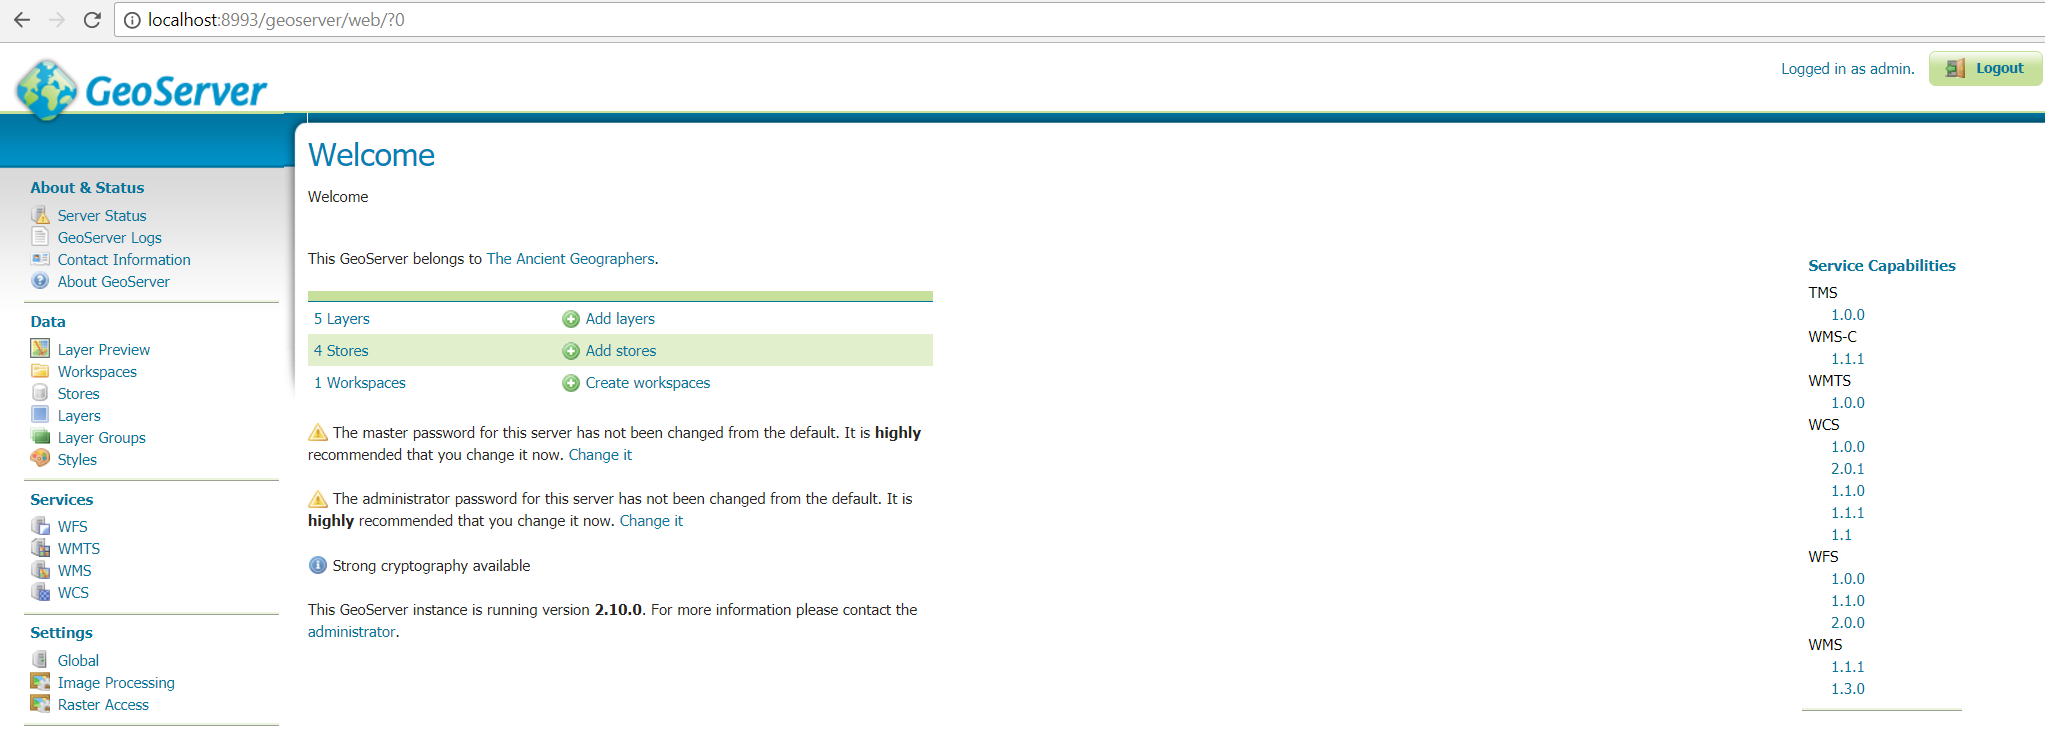
The homepage displays the layers, stores, and workspaces that were created in the demo. Select "Layer Preview" from the menu on the left side.
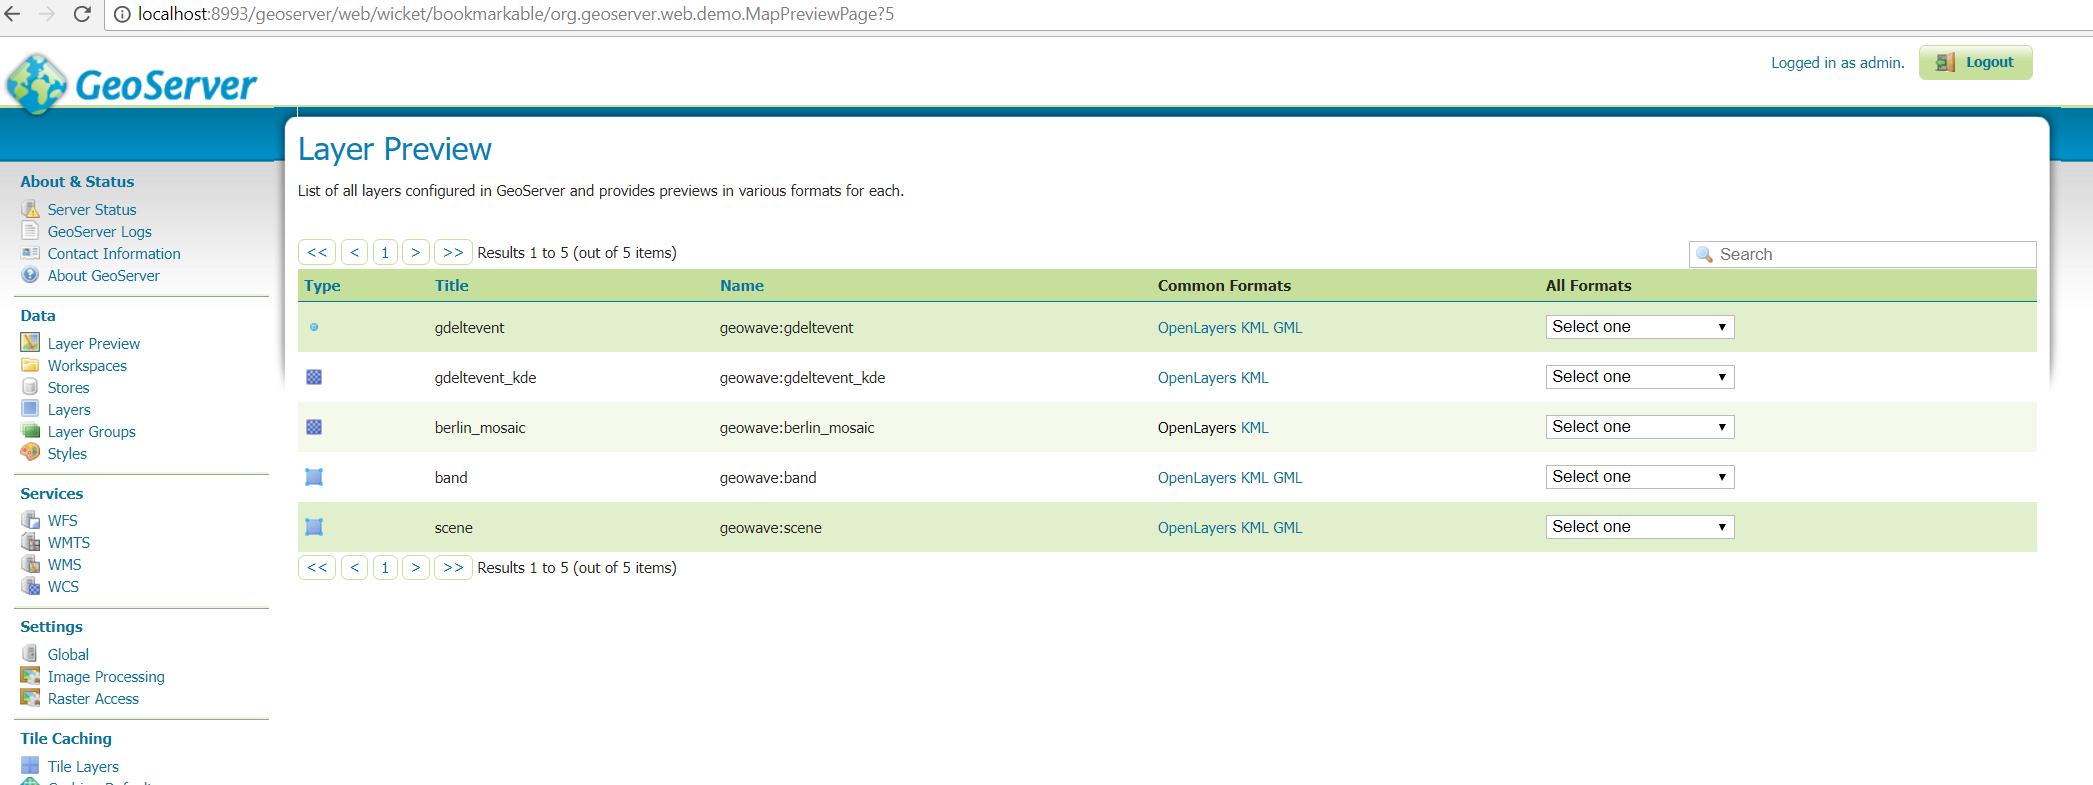
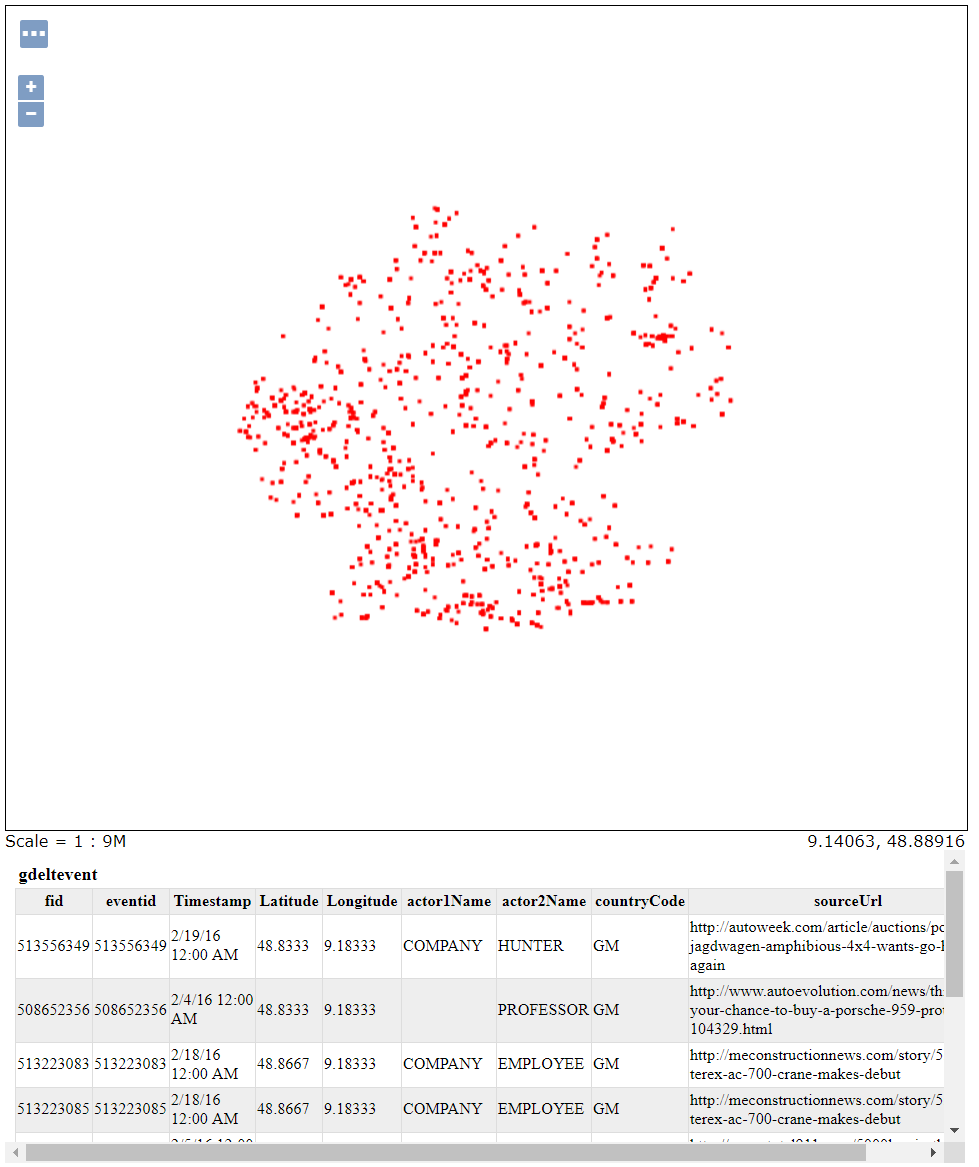
Click on the OpenLayers link by any of the layers to view any of the images. Clicking on the layer will give you the metadata associated with that point.
gdeltevent - shows all of the gdelt events in a bounding box around Berlin as individual points.
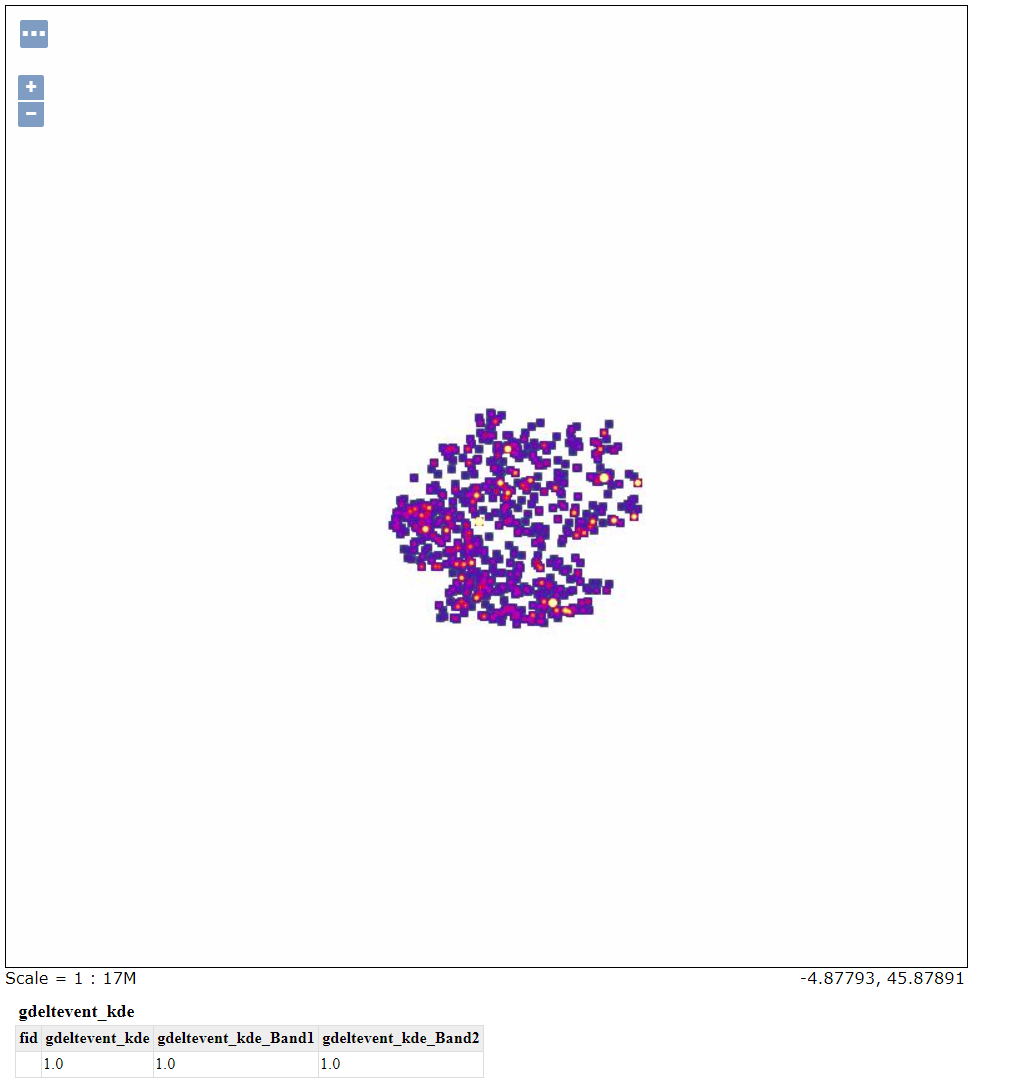
gdeltevent_kde - a heat map produced using kernel density estimation in a bounding box around Berlin.
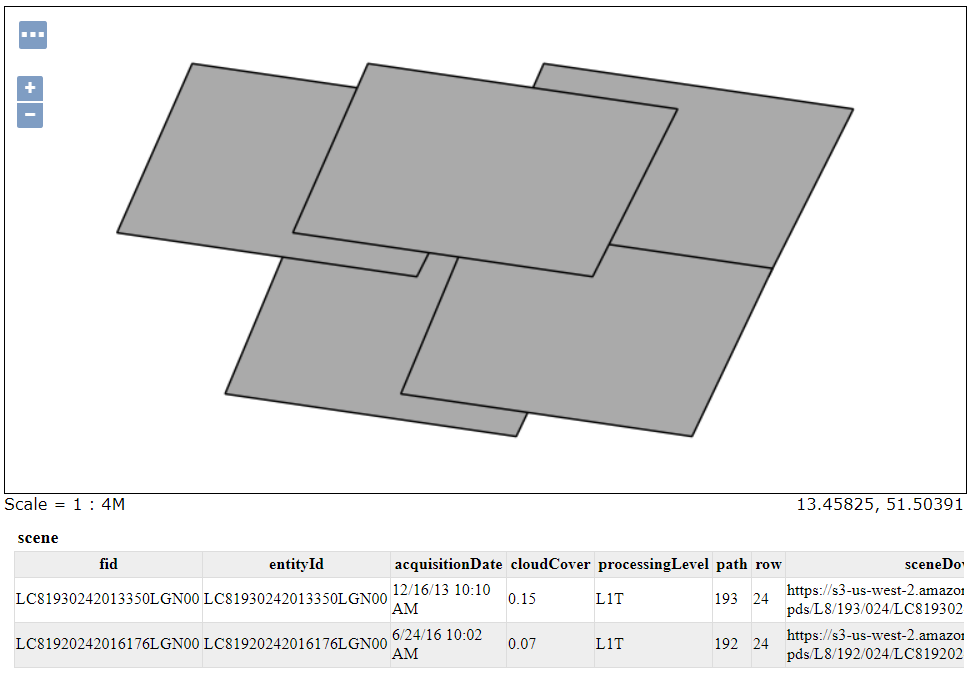
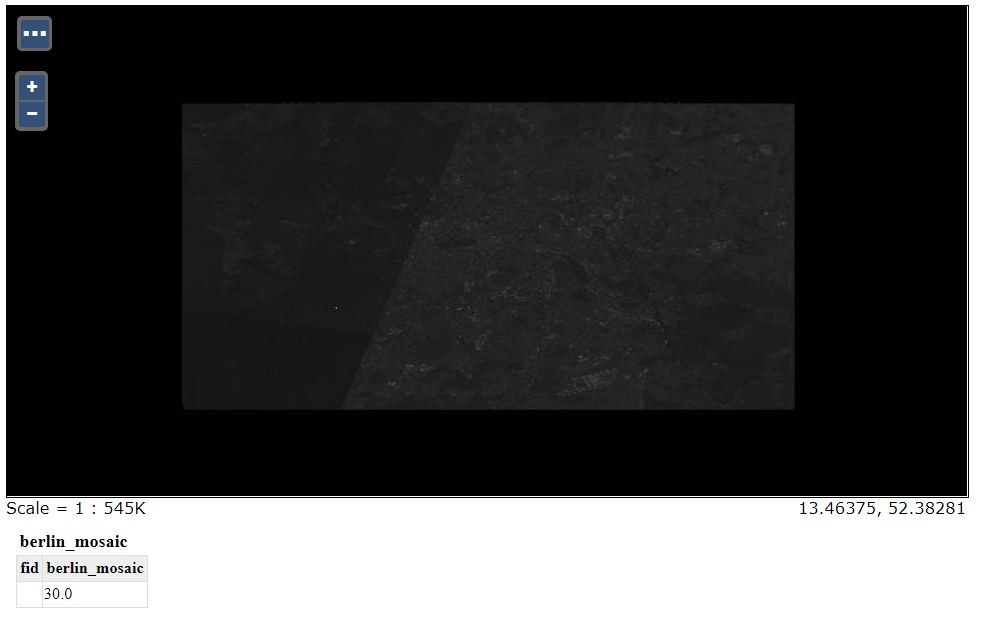
berlin_mosaic - a mosaic created from the raster data that fit into our specifications. This mosaic is made of 5 images.
band/scene - representations of the vector data associated with the images. The band and scene layers are identical in this demo.