Mail Traffic Report
|
|
For each email address the Mail Traffic Report lists the FirstName, LastName, Email address along with the number of Inbound, Outbound message and their Total Count over the selected period: last 7, 14 or 30 days. To
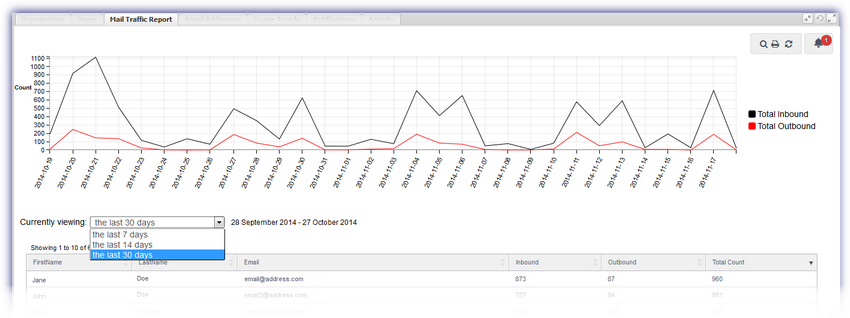
Toggle any item in the graphs legend to show or hide its data in the graph, when deselected the indicator is grayed out in the legend.
|
Total Inbound |
|
|
Total Outbound |
The following display and management options are available for this section.
|
Icon |
Option |
|
|
|
|
Opens the Users tab of the Dashboard in a new window ready for printing |
|
|
Search |
Open or close the Search box by clicking upon the magnifying glass. Enter the search criteria and press return to dynamically display all matching results. Clear the search box by clicking the red X |
|
|
Refresh |
Click to refresh the data in the selected tab |
|
|
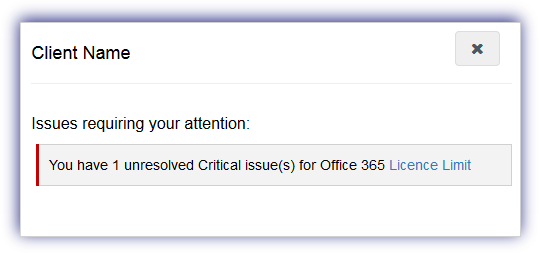
Alert |
The notification alert button provides a visual indicator of the number of issues currently affecting the service requiring your attention and is based on the current highest severity level. Click the alert button to display information on all of the unresolved problems of this severity type and select the issue link to open the Notifications tab focused on these specific messages. Once finished in the notification alert dialog select X to close. Please note that the notification alert reflects the current highest level of severity. For example if the notification alert displays one critical issue, after resolving this issue any warning level messages are then displayed.
|
As a large number of entries may be returned for this table we have included the option to set the number of records per page 10, 25. 50 or 100. With navigation between pages achieved by clicking on the required page number or by using the next > or previous buttons <
To sort the information contained in the columns simply click on the relevant column header.